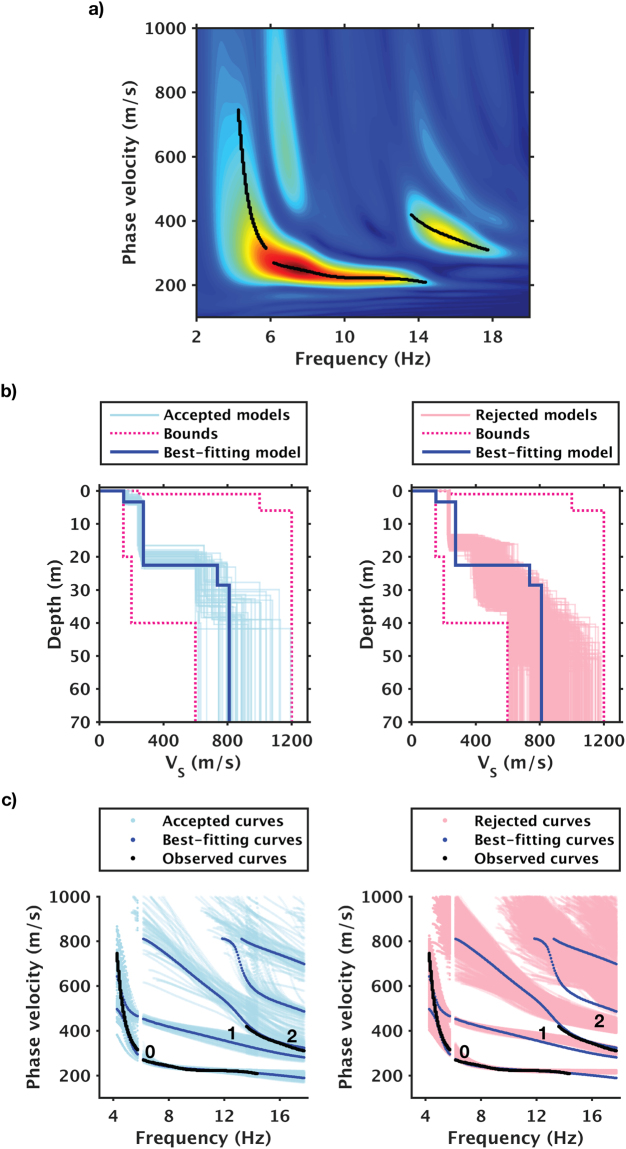
Figure 6.
Dispersion measurement and inversion results of a 24-hour stack. (a) Dispersion measurements. (b) Top 0.1% best-fit models. (c) Observed and model-predicted (using profiles shown in (b)) dispersion curves. Black dots in (a) denote observed multimodal dispersion curves; 0, 1, and 2 in (c) denote fundamental mode, 1st higher mode, and 2nd higher mode. Left and right columns in (b) and (c) show accepted and rejected models respectively.

