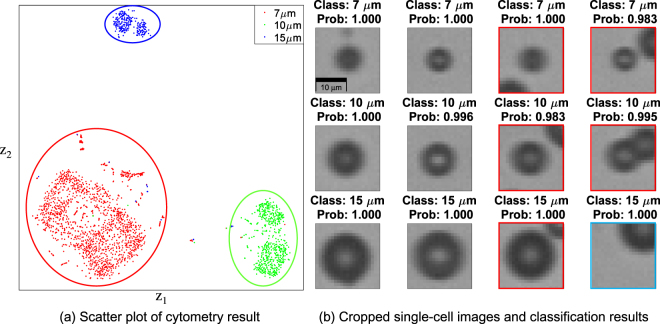
Figure 3.
(a) Scatter plot of cytometry result of mixed-size bead suspension. t-SNE embedding was applied to reduce the high dimensional feature map to two dimensions for visualization. The output of the last hidden layer has originally 300 dimension, and t-SNE embedded its dimension to depict the classification result. Each axis represents the latent space (z) variable embedded by t-SNE. Point colors are labelled according to its classes: 7 μm (red): 1,540 points, 10 μm (green): 549 points, 15 μm (blue): 257 points. (b) Cropped single-bead images and their classification results. Some cropped single-cell images include another bead (doublet; red boxes) but the classifier predict category of the object near the centre position with high probability. This property can filter out doublet. In addition, cyan box shows a case that the object is not located at the centre position but classifier can predict its class due to the invariance of convolutional neural networks to small translation.

