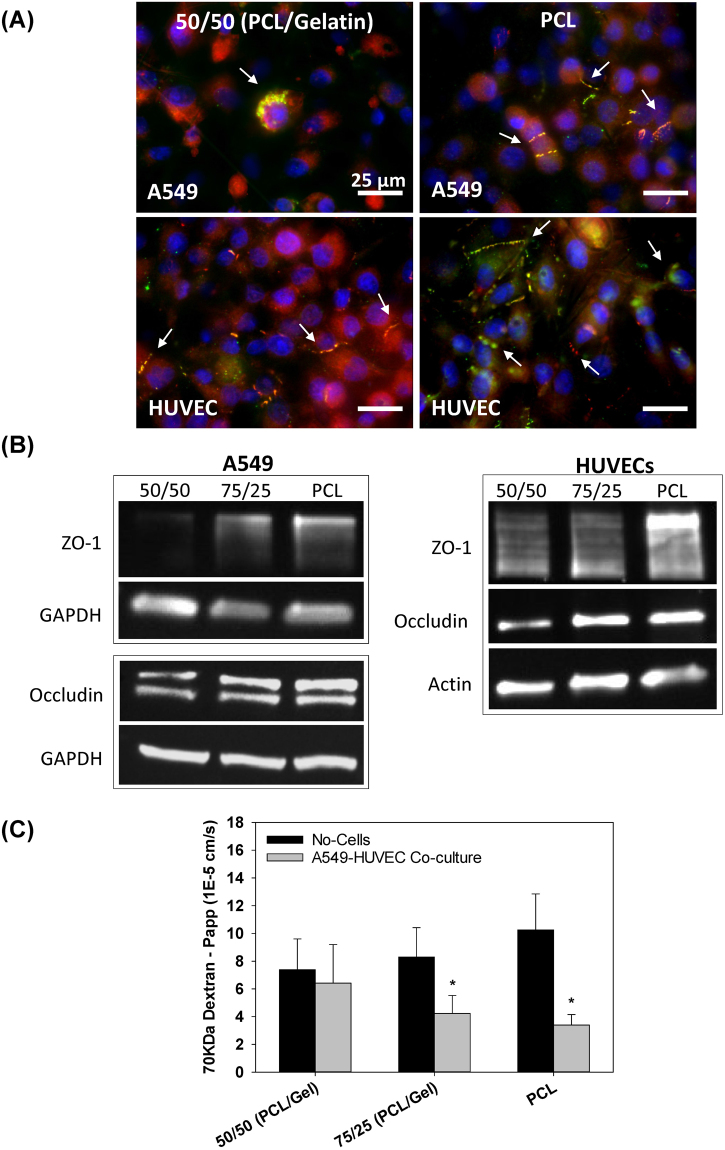
Figure 6.
(A) tight junctions staining (ZO-1: red, Occludin: green, nuclei: blue) of epithelial and endothelial cells co-cultured on PCL (right) or 50/50 (PCL/gelatin) (left) fibers (scale bars: 25 µm). (B) Characterization of ZO-1 and occludin relative expression, and (C) transport of 70 KDa FITC-labeled dextran across co-cultured epithelial/endothelial cells after 60 minutes (2-day co-cultures) (mean ± SEM. *Indicates significant difference with respect to No-cells (control) group (p = < 0.029).

