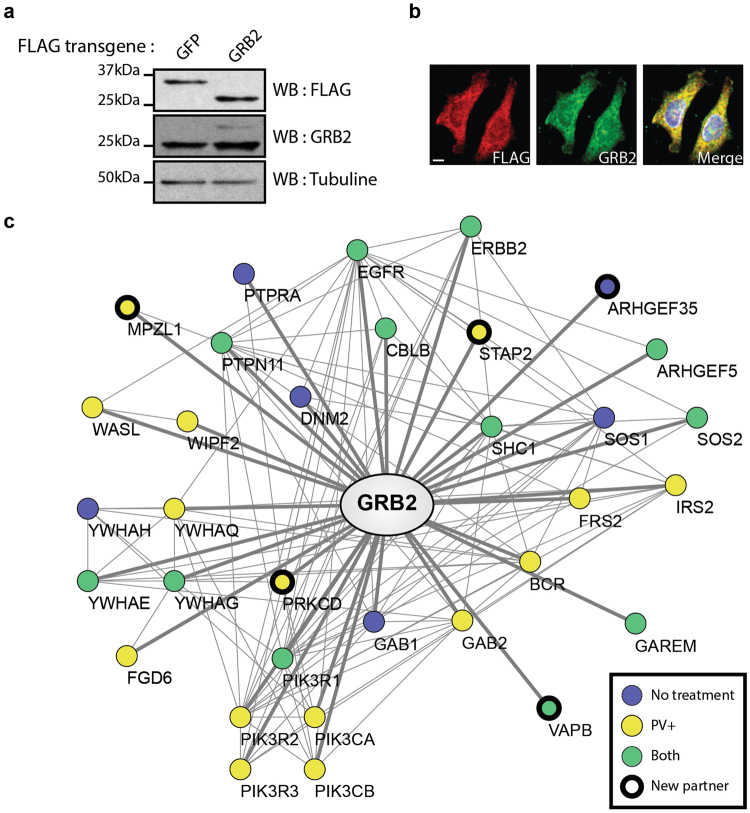
Figure 1.
Protein interaction network mapping in HCC1954 HER2+ cells reveals new GRB2 binding partners. (a) Clonal stable cell lines expressing either 3xFLAG-GFP (30 kDa) or 3xFLAG-GRB2 (28 kDa) fusion proteins were analyzed by Western blot to evaluate transgene expression. (b) FLAG-GRB2 cells were analyzed by immunofluorescence to verify protein localization (scale bar = 10 μm). (c) GRB2 protein interaction network obtained by AP-MS from HCC1954 cells treated or not with a phosphatase inhibitor (PV). Proteins displaying a SAINT score above 0.9 are represented in the network (Supplementary Table S1). Edges represent interactions obtained by AP-MS (bold) or previously reported (narrow).

