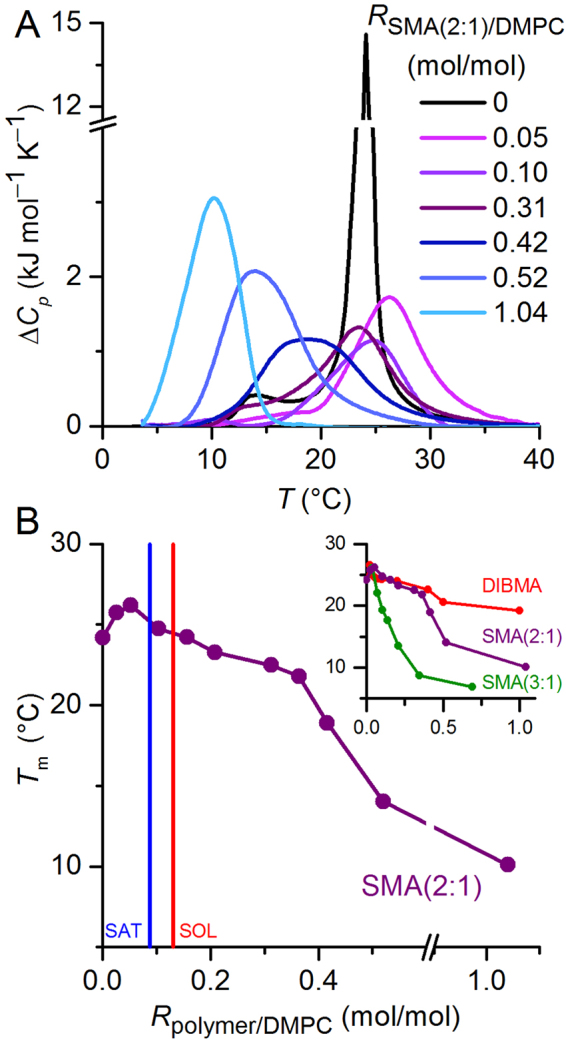
Figure 4.

Thermotropic phase behaviour of DMPC upon solubilisation by SMA(2:1) at pH 7.4. (A) DSC thermograms showing excess molar isobaric heat capacities, ∆C p, of 5 mM DMPC initially present in the form of LUVs upon exposure to increasing concentrations of SMA(2:1). (B) Gel-to-fluid phase transition temperature, T m, of 5 mM DMPC in the presence of increasing concentrations of SMA(2:1), SMA(3:1), or DIBMA. SMA(3:1)/DMPC molar ratios were recalculated from Oluwole et al.18 using the dn/dc value determined in this work (cf. Table 1). Vertical lines in the main panel indicate the SAT and SOL boundaries of SMA(2:1) derived from NMR at 30 °C (Fig. 1C). The same T m values are shown as functions of polymer/DMPC mass ratios in Supplementary Figure 1.
