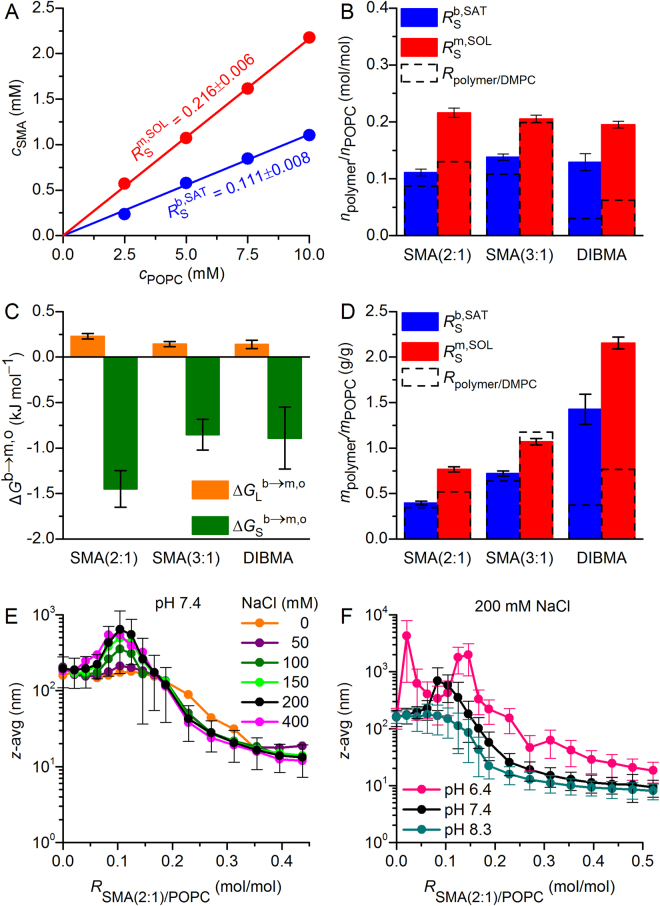
Figure 5.
Solubilisation of POPC vesicles by SMA(2:1) at 25 °C as monitored by 31P NMR and DLS. (A) Phase diagram of POPC/SMA(2:1) showing the onset (saturation; SAT) and completion (solubilisation; SOL) of solubilisation. Shown are pairs of and (circles) obtained from breakpoints derived from local fits and global fits (solid lines). (B) SAT and SOL phase boundaries of SMA(2:1), SMA(3:1), and DIBMA based on copolymer/lipid molar ratios. For comparison, corresponding SAT and SOL phase boundaries determined for DMPC (Fig. 2A) are indicated as dashed bars. (C) Transfer free energies of lipid and copolymers, and , respectively, as derived from phase boundaries in (B). (D) SAT and SOL phase boundaries of SMA(2:1), SMA(3:1), and DIBMA based on copolymer/lipid mass ratios. For comparison, corresponding SAT and SOL phase boundaries determined for DMPC (Fig. 2C) are indicated as dashed bars. (E) z-Average diameters as functions of SMA(2:1)/POPC molar ratio at different NaCl concentrations. (F) z-Average diameters as functions of SMA(2:1)/POPC molar ratio at pH values of 6.4, 7.4, and 8.3. Error bars denote peak distribution widths as given by σ =.

