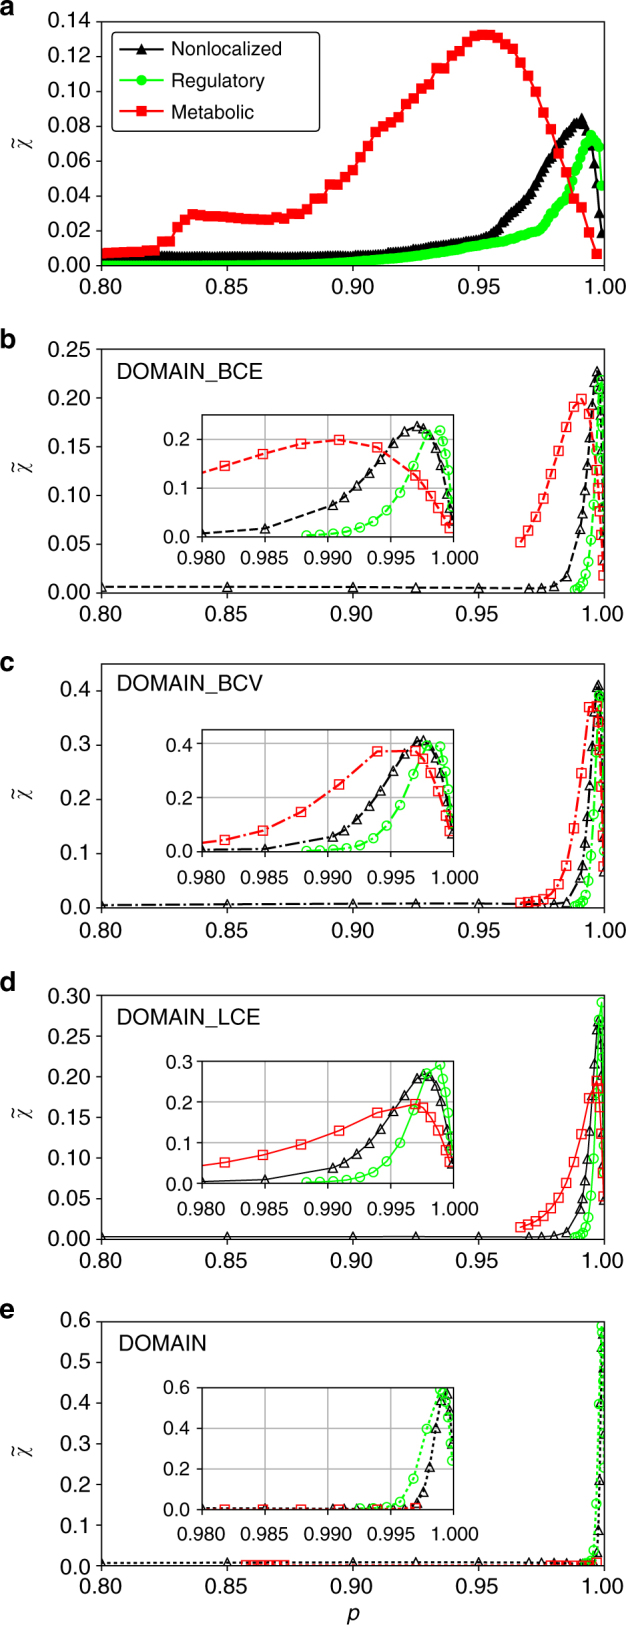
Fig. 4.

Susceptibility of the integrative E. coli network and its randomized versions for distinct localized perturbations. In each panel, the average over 500 runs for an initial perturbation size, q = 1 − p, of the original network a and the four randomization schemes in decreasing stringency order b–e is shown. For each scheme 500 graph realizations have been considered. While non-localized perturbations are presented in black, perturbations initiated in gene regulatory domain and metabolic domain are given in green and in red, respectively
