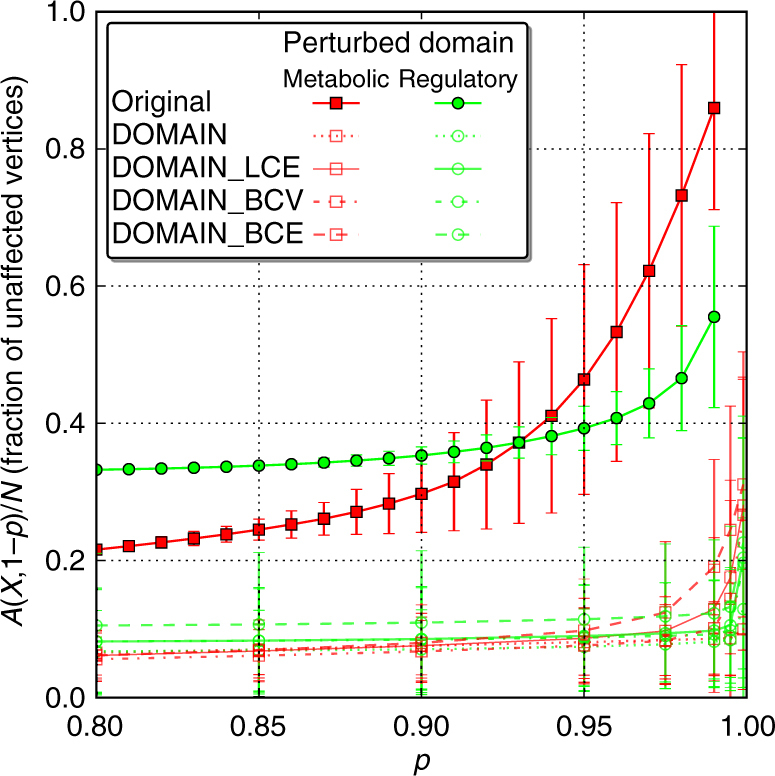
Fig. 5.

Fractions of unaffected vertices of the integrative E. coli network and its randomized versions for distinct localized perturbations. Per initial perturbation size, q = 1 − p, 5000 runs were averaged for the original network (filled markers) and the four randomization schemes (open markers), where in turn, 500 realizations are considered for each scheme. Initial perturbations in the gene regulatory domain are presented as green dots, while perturbations initiated in the metabolic domain are given as red squares. The error bars indicate s.d. (results for randomized realizations have been combined)
