Figure 3.

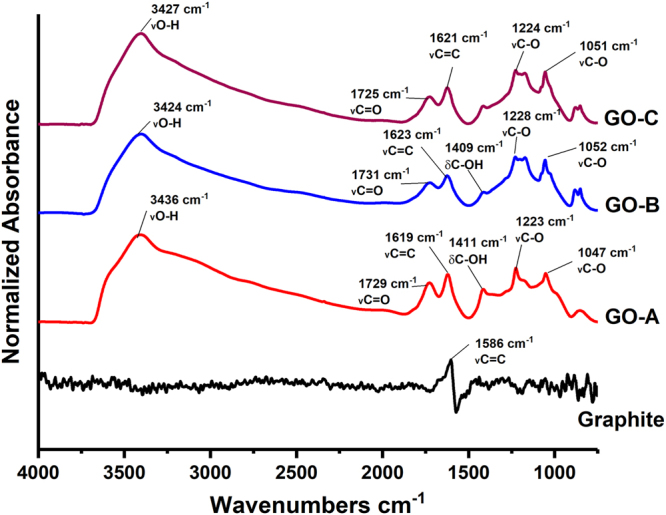
FTIR spectra of graphite and GO (graphite – Without oxidation, GO-A:0.5 h, GO-B:2 h, and GO-C:4 h oxidation) samples prepared with variable oxidation times showing oxidation dependent changes in GO functional groups.

FTIR spectra of graphite and GO (graphite – Without oxidation, GO-A:0.5 h, GO-B:2 h, and GO-C:4 h oxidation) samples prepared with variable oxidation times showing oxidation dependent changes in GO functional groups.