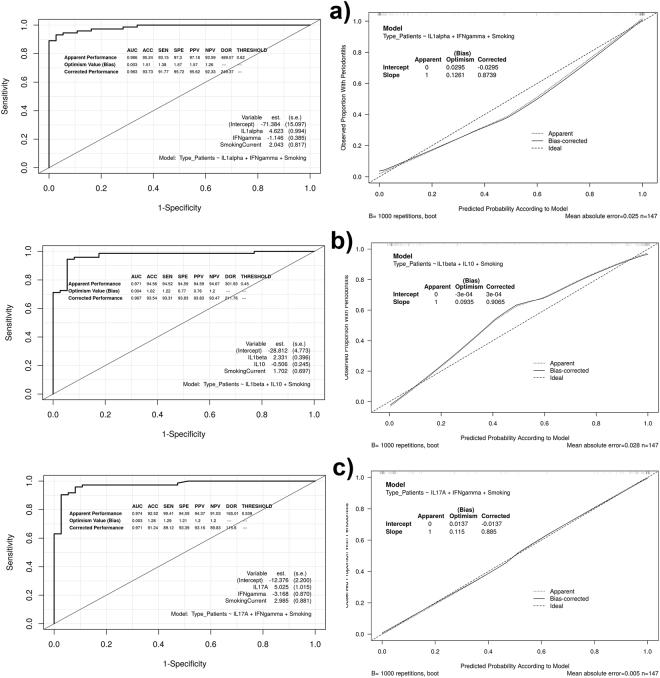
Figure 4.
ROC curves and calibration plots of the two-cytokine models, including the apparent and bias-corrected measures by bootstrapping. In the calibration plots, the predicted probability of the model is represented on the x-axis and the observed proportion of chronic periodontitis is represented on the y axis. The 45° line indicates perfect congruity between the predicted probability and the observed proportion of chronic periodontitis.

