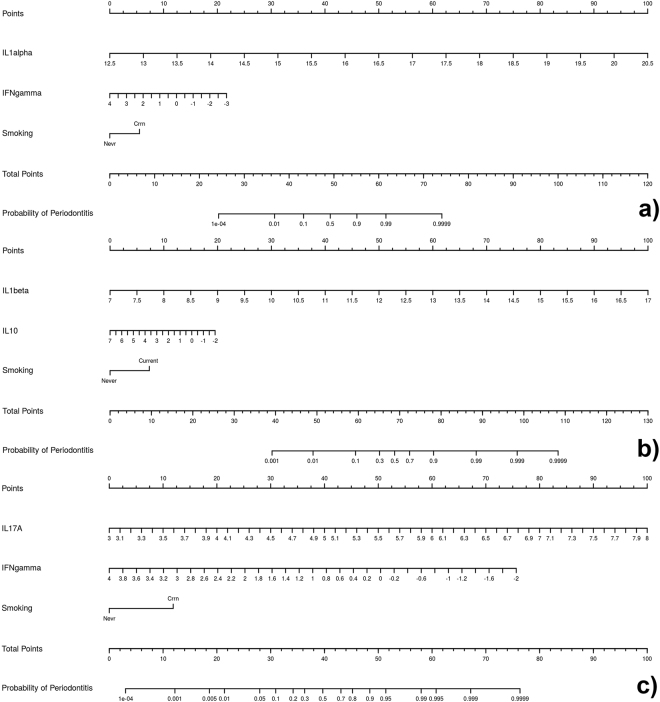
Figure 6.
Nomograms based on the two-cytokine models predicting the probability of chronic periodontitis. The probability of chronic periodontitis is calculated by drawing a line to the point on the axis for each of the following variables: (a) IL1alpha, IFNgamma and “smoking”; (b) IL1beta, IL10 and “smoking”; (c) IL17A, IFNgamma and “smoking”. The points for each variable are summed and located on the total point line. Next, a vertical line is projected from the total point line to the predicted probability bottom scale to obtain the individual probability of chronic periodontitis.

