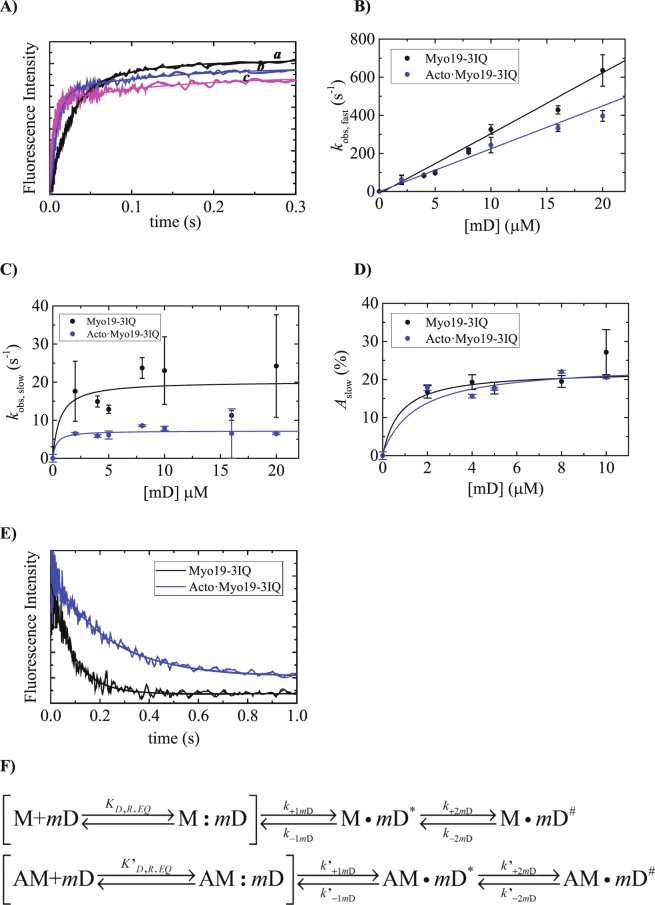
Figure 5.
Binding kinetics of mD to Myo19-3IQ and Acto·Myo19-3IQ by monitoring FRET upon tryptophan excitation to mant-fluorophore. (A) Time courses of 2′/3′-mD fluorescence change after mixing 200 nM Myo19-3IQ with 2 (a), 5, (b) and 10 µM (d) 2′/3′-mD. The smooth lines are the best fit to a double exponential. (B) The dependence of k obs, fast on [2′/3′-mD]. The solid line through the data points is the best fit linear function. Error bars represent standard deviation from two independent experiments. (C) The dependence of k obs, slow on [2′/3′-mD]. The solid line through the data points is the best fit to hyperbola. Error bars represent standard deviation from two independent experiments. (D) The dependence of the amplitudes of the slow phase (A slow) on [2′/3′-mD]. The solid line through the data points is the best fit to hyperbola. Error bars represent standard deviation from two independent experiments. (E) The dissociation of the 2′/3′-mD from Myo19-3IQ and from Acto·Myo19-3IQ. The time courses of the 2′/3′-mD fluorescence change after mixing 250 nM Myo19-3IQ∙mD with 1000 µM ATP in the absence or presence of 275 nM phalloidin stabilized actin filaments. The smooth line is the best fit to single exponential function. (F) The kinetic reaction mechanism for mD binding to Myo19-3IQ and for Acto·Myo19-3IQ. In rectangular parenthesis, the rapid collision complex formation is shown most likely occurring without fluorescence change.

