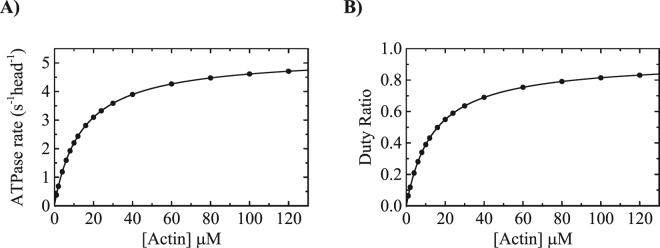
Figure 8.
Simulation of the ATPase activity and duty ratio of Myo19-3IQ (A). Simulated steady state [actin]-dependence of the ATPase activity of the Myo19-3IQ. The solid lines through the data points are the best fit to a rectangular hyperbola (. (B) Duty ratio as a function of [actin]. The duty ratio was calculated from the summation of all the biochemical intermediates distribution at each [actin] at the steady-state time regime according to equation: duty ratio = (strongly bound states)/(strongly bound states + weakly bound states). The solid lines through the data points are the best fit to a rectangular hyperbola ().

