
Fig. 10.
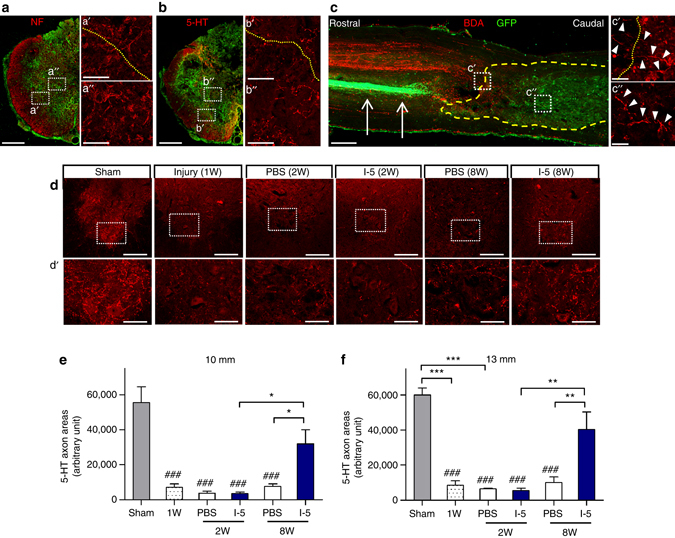
I-5 supports axon growth and promotes axonal reinnervation. a, b NF positive (a) and 5-HT (b) axon growth in the FN-rich matrix in the tansverse spinal cord sections at the epicenter of the lesion in animals with I-5 injection. Red indicates NF (a) or 5-HT (b) and green indicates FN immunoreactivity. The boxed regions in a, b are magnified in aʹ, bʹ and a″, b″. The dotted lines in aʹ, bʹ indicate the margins of the FN-rich matrix. Scale bars in a, b represent 500 µm. Scale bars in the magnified images represent 100 µm. c A representative image of the longitudinal spinal cord section from an animal with I-5 hydrogel. Descending axons were traced with AAV8-GFP and biotinylated dextran amine (BDA). The tissue section was stained with Alexa Fluor 594-conjugated streptavidin (red) and FN antibody (green). The corticospinal tract (arrows) was visualized by GFP signal. The yellow dashed line indicates the boundary of the FN-rich matrix. Boxed regions were magnified in cʹ, c″. Arrowheads indicate BDA-traced axons. The scale bar in c represents 500 µm and the scale bars in cʹ, c″ represent 50 µm. d 5-HT axon innervation in the ventral motor regions of the lumbar spinal cord in sham-operated animals, animals with injury alone sacrificed 1 week (W) after injury, animals with PBS or I-5 injection sacrificed 2W or 8W after injury. The boxed regions in d are magnified in dʹ. Scale bars in d, dʹ represent 500 and 100 µm, respectively. e, f Quantification of 5-HT axon density in the ventral motor regions in the lumbar spinal cord. Quantification was done at 10 mm (e) or 13 mm (f) caudal to the epicenter. * and *** indicate p < 0.05 and p < 0.001 by one-way ANOVA followed by Tukey’s post hoc analysis. ### indicates p < 0.001 compared to sham-operated group by one-way ANOVA followed by Tukey’s post hoc analysis. N = 5, 4, 4, 5, 9 and 8 for the sham-operated, PBS (1W), PBS (2W), I-5 (2W), PBS (8W), or I-5 (8W) groups, respectively. Error bars represent the SEM