
Fig. 4.
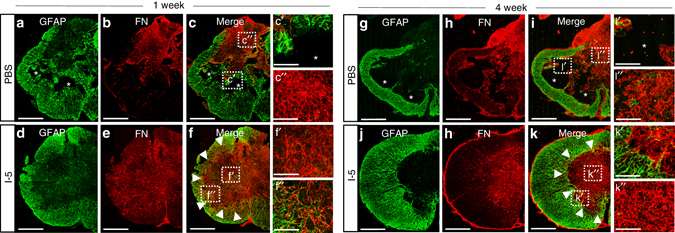
Remodeling of extracellular matrix by I-5 injection. a–f Representative images of transverse spinal cord sections obtained at 1 week after injection from animals with PBS (a–c) or I-5 (d–f) injection. Arrowheads indicate the border between the GFAP- and FN-positive areas. Boxed regions in c, f were magnified in cʹ, c″, fʹ, f″. cʹ Early cavity space (*) surrounded by GFAP-immunoreactive astroglial cells. c″ FN-rich extracellular matrix (ECM). fʹ FN-rich ECM. f″ GFAP and FN immunoreactivity intermingled in the border region. g–k Representative images of transverse spinal cord sections obtained 4 weeks after injection from animals with PBS (g–i) or I-5 (j–k) injection. Arrowheads indicate the border between the FN and GFAP immunoreactivities. Boxed regions in i, k were magnified in iʹ, i″, kʹ, k″. iʹ A cystic space (*) with residual FN-immunoreactive matrix. i″ FN-rich ECM at the periphery of the lesion center. kʹ The sharp boundary between the FN- and GFAP-positive areas. k″ Formation of dense and strong FN-rich matrix in the center of the lesion. All asterisks indicate cystic cavities. Scale bars represent 500 μm in a–k. Scale bars in the magnified images represent 100 μm