
Fig. 6.
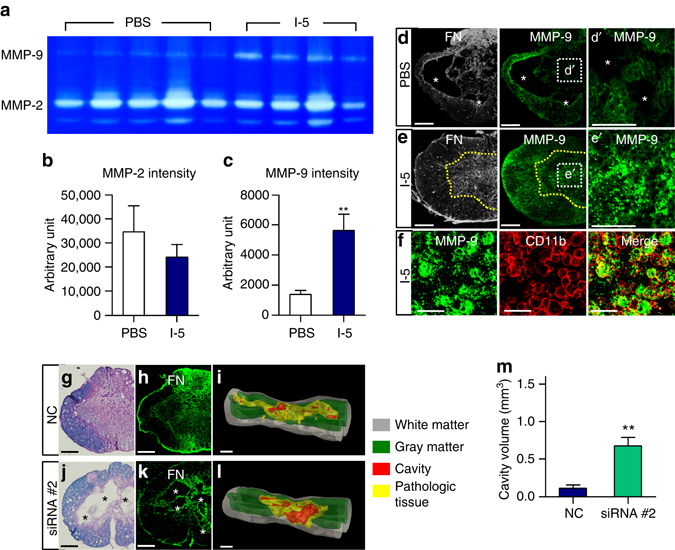
MMP-9 mediates fibrotic ECM remodeling. a Gelatinase activity of MMP-9 and MMP-2 in the PBS (N = 5) and the I-5 group (N = 4) examined by zymography. b, c Graphs showing quantification of MMP-2 (b) and MMP-9 (c) activity. ** indicates p < 0.01 by two-tailed Student’s t-test. Error bars represent the SEM. d, e Representative images of transverse spinal cord sections from animals injected with either PBS (d) or I-5 (e). Asterisks indicate cystic cavities. A yellow dotted line indicates the boundary of the FN-rich matrix. The boxed regions in the middle panels were magnified in dʹ, eʹ. Scale bars represent 100 µm. f MMP-9 immunoreactive granules were bounded by CD11b positive membrane-like circular structures. Scale bars represent 50 µm. g, j Representative images of transverse spinal cord sections stained with eriochrome cyanine and eosin from animals with I-5 mixed with non-targeting control siRNA (NC) (g) or MMP-9 siRNA (j). Adjacent sections were stained with antibodies against FN (h, k). Scale bars represent 200 μm. i, l 3D reconstruction of the spinal cord tissue using the Neurolucida software. Scale bars represent 1 mm. Asterisks indicate cystic cavities. m Quantification graph of cavity volume. ** indicates p < 0.01 by two-tailed Student’s t-test. N = 5 for each group. Error bars represent the SEM