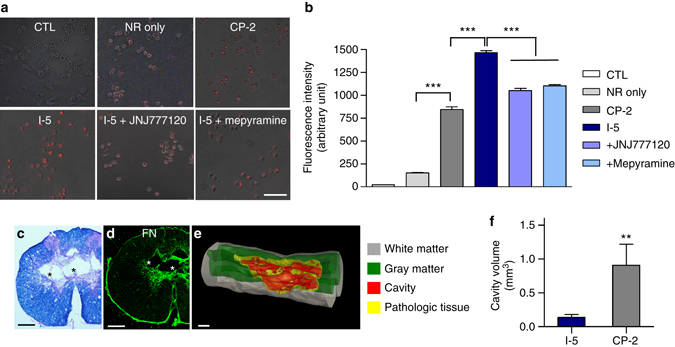
Fig. 7.

Interaction between macrophages and I-5 hydrogel. a Representative images of Nile Red fluorescence in a macrophage cell line. Cultured macrophages were treated with Nile Red (NR) alone or nanoparticles consisting of NR and either CP-2 or I-5. In addition, JNJ7777120, a histamine receptor 4 inhibitor, or mepyramine maleate, a histamine receptor 1 inhibitor, was added to the culture medium 30 min before treatment with I-5 polymer nanoparticles. Scale bar represents 50 µm. b Graph showing quantification of NR fluorescence intensity. *** indicates p < 0.001 by one-way ANOVA followed by Tukey’s post hoc analysis. N = 4 replicate experiments per group. Error bars represent the SEM. c, d Representative images of transverse spinal cord sections from animals injected with CP-2 hydrogel lacking the imidazole group. c Eriochrome cyanine and eosin staining revealed prominent cystic cavities (*) at the center of the lesion (c). d FN staining showed a smaller area of FN-rich matrix. Scale bars represent 200 μm. e 3D reconstruction of the spinal cord tissue from an animal injected with CP-2 hydrogel using the Neurolucida software. Scale bar represents 1 mm. f Graph showing the quantification of the cavity volumes. The data set for the I-5 group was the same as the one used in Fig. 3f. ** indicates p < 0.01 by two-tailed Student’s t-test. N = 8 for the I-5 group and N = 5 for the CP-2 group. Error bars represent the SEM
