
Fig. 9.
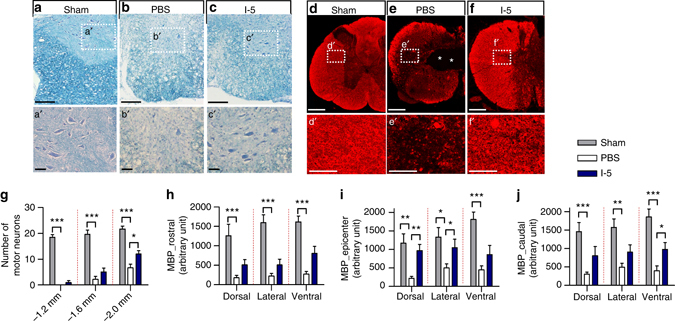
I-5 injection preserves motor neurons and myelinated white matter. a–c Representative images of the ventromedial region in transverse spinal cord sections 1.6 mm caudal to the epicenter from animals in sham-operated (a), PBS (b) and I-5 (c) injection groups. The sections were stained with eriochrome cyanine and cresyl violet. Boxed regions in a–c are magnified in aʹ–cʹ. Surviving motor neurons were more frequently observed in the I-5 than PBS injection group. Scale bars represent 200 µm in a–c and 50 µm in aʹ–cʹ. d–f Representative images of MBP immunostaining in transverse spinal cord sections of the lesion epicenter from animals in sham-operated (d), PBS (e) and I-5 (f) groups. Boxed regions in d–f are magnified in dʹ–fʹ. Scale bars represent 500 µm in d–f and 50 µm in dʹ–fʹ. g Quantitative comparison of the number of motor neurons. h–j Graphs showing quantification of the fluorescence intensity of MBP immunoreactivity. Quantification was performed in the sections located 2 mm rostral (h) to the epicenter, at the epicenter (i), and 2 mm caudal (j) to the epicenter. At each level, three ROIs were selected: one each in dorsal, lateral, and ventral white matter. *, ** and *** indicate p < 0.05, p < 0.01 and p < 0.001, respectively, by one-way ANOVA followed by Tukey’s post hoc analysis. N = 5, 9 and 8 for the sham-operate, PBS and I-5 groups, respectively. Error bars represent the SEM