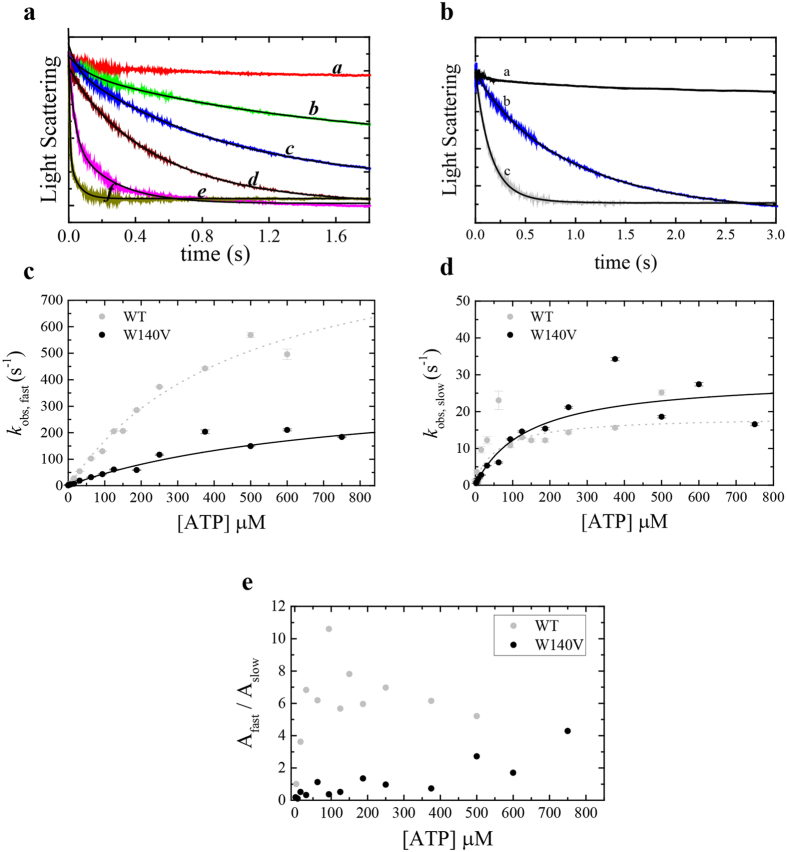
Figure 7.
ATP binding to Acto·Myo19W140V-3IQ (W140V) shows different kinetic behavior than the Myo19-3IQ (WT) (a). Time courses of light scattering decrease after mixing 0.25 µM actomyosin with 0 µM (a), 1.95 (b), 3.9 (c), 7.8 (d), 62.5 (e), 125(f), µM ATP for Acto·Myo19W140V-3IQ. Data are averaged transients (n = 3–5). The black lines are the best fits to double exponential function (see SI for analysis of the residuals of the fits). (b) Time course of light scattering decrease after mixing 0.25 µM actomyosin with 0 µM (a) or 7.8 µM ATP for Acto·Myo19-3IQW140V (b) or Acto·Myo19-3IQ (c). Data are averaged transients (n = 3–5). The smooth lines through the data represent best fit to double exponential function (c). [ATP]-dependence of the fast-observed rate constant of ATP binding to Acto·Myo19-3IQW140V in comparison to Acto·Myo19-3IQ as measured by light scattering. (d) [ATP]-dependence of the slow observed rate constant of ATP binding to Acto·Myo19-3IQW140V in comparison to Acto·Myo19-3IQ as measured by light scattering. The lines through the data points in c and d are the best fit to rectangular hyperbola. Error bars of the fitting are within data points. (e) The ratio of the fast (Afast) to slow (Aslow) amplitudes of the observed fast and slow rate constants as a function of [ATP] for Acto·Myo19-3IQW140V in comparison to Acto·Myo19-3IQ. Data for Myo19-3IQ (WT) is reproduced from (Usaj & Henn, parallel submission).

