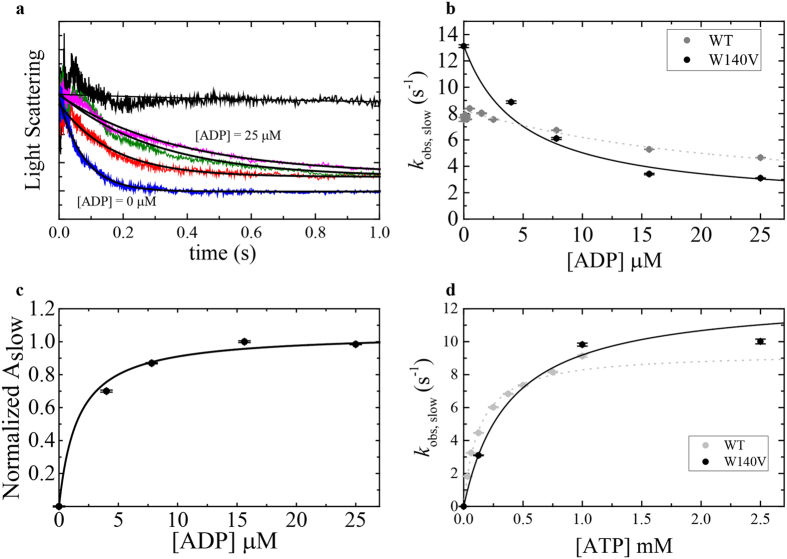
Figure 8.
ADP dissociation from Acto·Myo19-3IQ W140V (W140V) measured by kinetic competition with ATP in comparison to Acto·Myo19-3IQ (WT). (a) Normalized time courses of light scattering decrease after mixing 0.2 µM Acto·Myo19-3IQW140V with 0 µM ATP (upper trace) or 125 µM ATP in presence of different [ADP] ranging from 0 to 25 µM. Data are averaged transients (n = 3–5). Smooth lines (black) through the data represent best fits to double or single exponential functions. (b) [ADP]-dependence of the observed slow rate constant for Acto·Myo19-3IQ and single observed rate constant for Acto·Myo19-3IQW140V as measured by kinetic competition with 125 µM ATP. (c) [ADP]-dependence of normalized amplitudes of the slow phase obtained by fitting transients described in (a). (d) [ATP]-dependence of the observed rate constant for Acto·Myo19-3IQ and Acto·Myo19-3IQW140V dissociation as measured by light scattering at saturated [ADP] of 25 µM. The lines through the data points in (b,c and d) are the best fits to rectangular hyperbola. Error bars of the fittings are within data points. Data for Myo19-3IQ (WT) is reproduced from (Usaj & Henn, parallel submission).

