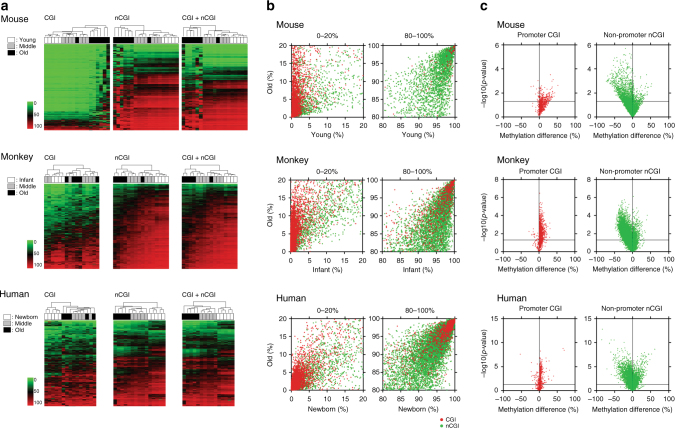
Fig. 1.
DREAM DNA methylation analysis of whole blood DNA from different species. a Unsupervised hierarchical clustering analysis of CpG sites in CpG island (CGI), non-CGI, and all genomic regions. The green to red color scale indicates the methylation percentage. The color codes for age are shown on the left. b DNA methylation in old vs. newborn/infant/young. Average DNA methylation level of each CpG site in old individuals (y axis) is plotted against that in newborn/infant/young individuals (x axis). The red and green dots represent CGI and non-CGI CpG sites, respectively. The low range (0–20%) and high range (80–100%) of methylation status are shown. c Volcano plots show CpG sites differentially methylated between old and newborn/infant/young. Plots on left are sites in promoter CGI (red) and on right site are sites in non-promoter non-CGI (green). The promoter region is defined as –1 kb ≤ TSS ≤+ 500 bp. The methylation difference between old and newborn/infant/young is shown on the x axis, the p-value (in –log10 scale) on the y axis. The horizontal line indicates p-value at 0.05

