Figure 2.
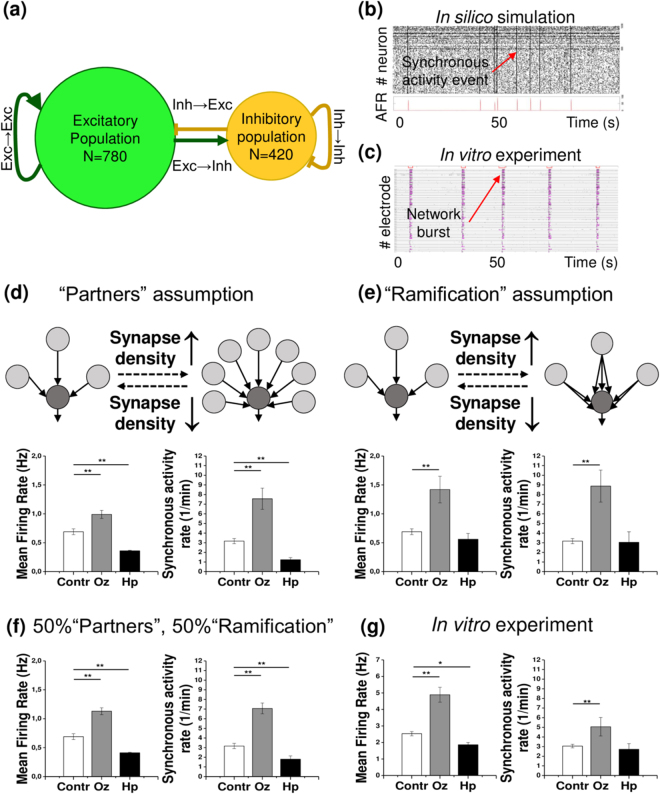
In silico simulations predict the neural network activity changes induced by olanzapine (Oz) and haloperidol (Hp) based on synapse density modifications. (a) The schematic illustrates the composition and connection types of the in silico networks. (b,c) Exemplary raster plots of in vitro and in silico network activity. (b) The raster plot of a 100 sec episode of simulated network activity (#1–780 excitatory and #781–1200 inhibitory neurons) illustrates the stationary activity pattern. The instantaneous average firing rate (AFR) is plotted to visualize the synchronous network activity events. (c) The raster plot of 100 sec episodes of activity in 60 MEA electrodes is shown for a control 21 DIV culture, exemplifying the representative network activity pattern. Black hatches indicate single spikes, magenta lines stand for bursts, red bars (the upper line in each stack) mark the network burst events. (d) The cartoon illustrates the “Partners” assumption for simulation. The quantifications below display mean firing and synchronous activity rates, predicted by the simulation. (e) The cartoon illustrates the “Ramification” assumption. The quantifications below display mean firing and synchronous activity rates, predicted by the simulation. (f) Mean firing and synchronous activity rates were quantified following the “Mixed” assumption simulation. In this experiment, it was assumed that 50% of synapse density modifications contribute to connectivity changes in accordance with the “Partners” assumption, and the other 50% with the “Ramification” assumption. Each bar represents the mean ± SEM value, N = 5. (g) Mean firing rate and synchronous activity rate (network burst frequency) of mature (21 DIV) in vitro networks are shown. Each bar represents the mean ± SEM value, n = 4. The asterisks indicate significant differences with the control, based on the Kruskal-Wallis ANOVA test (*p < 0.05; **p < 0.01; ***p < 0.001).

