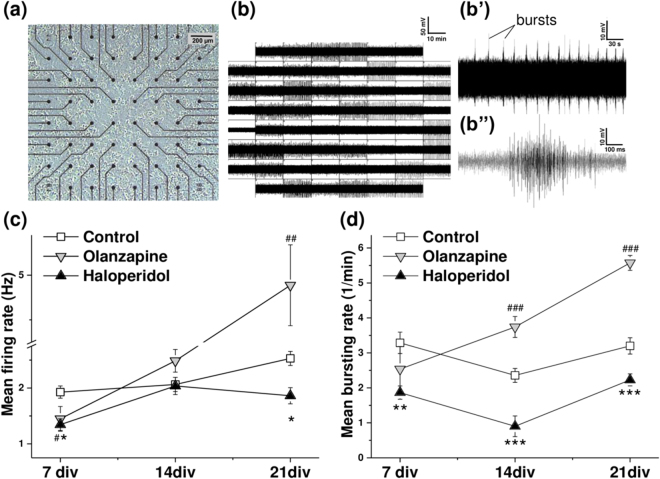
Figure 3.
Olanzapine and haloperidol modify spontaneous activity at different stages of network maturation. (a) Neuronal culture (21 days in vitro) grown on a multiple electrode array (MEA). (b(b”)) Electrical activity of mature (21 days in vitro) neuronal cultures. (b) The panel exemplifies a 15 min period of neural activity, recorded in 59 channels. The layout is arranged in accordance with the electrode position, shown in (a). (b’) The regular bursting pattern of activity detected by a single electrode. (b”) The line graph exemplifies a single burst structure. (c,d) White squares represent the control condition, grey downward triangles stand for the olanzapine and upward black triangles for the haloperidol treatment condition. The asterisks and hashes indicate significant differences with the control at a particular stage of maturation (haloperidol and olanzapine conditions respectively), based on the Kruskal-Wallis ANOVA test (*,#p < 0.05; **,##p < 0.01; ***,###p < 0.001). (c) Quantification of mean firing rate after 7, 14 and 21 days in vitro (DIV). Each data point indicates the mean ± SEM (Hz) of minimum 159 active electrodes, N = 4 (15 min recording time). (d) Quantification of mean bursting rate at 7 DIV, 14 DIV and 21 DIV stages of maturation. Each data point displays the mean ± SEM (bursts per minute) of minimum 41 (at 7 DIV), 48 (at 14 DIV) and 119 (at 21 DIV) bursting electrodes, N = 4 (15 min recording time).

