Figure 3.
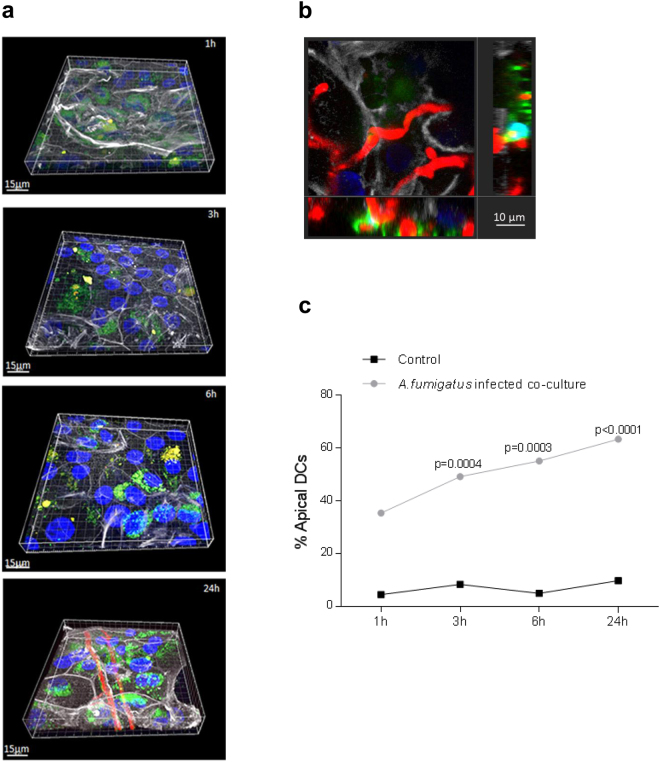
Z-stack series of DC migration through epithelia upon fungal infection. (a) Upon fungal infection, DCs (green) sense swollen conidia, germlings (1 h to 6 h, 1st to 3rd panel) and hyphae (24 h) (red) at the apical side of differentiated epithelia (white) and transmigrate over time to the apical side and upon destruction of the epithelium. Actin is illustrated in white, conidia/hyphae in red, nuclei in blue and DCs in green. (b) The image shows an x-y projection with the respective side views of DCs (green) interacting with hyphal filaments (red) at the surface of destroyed epithelial cells (white) at the 24 h time point. Bars, 10 µm. CLSM was performed capturing at least 3 different areas each containing more >25 cells per condition. (c) Percentages of apically visible DCs over time (1 h to 24 h) in infected DC/NHBE co-cultures are depicted. Significantly more DCs were found at 3 h, 6 h and 24 h at the apical layer compared to background percentages of control cells. Control cells remained at the basolateral side and no increase in DC numbers at the apical layer was detected. Numbers of DCs counted were ~125. Significant differences between infected and control co-cultures were calculated using an unpaired Student’s T test and the Graph Pad Prism software.

