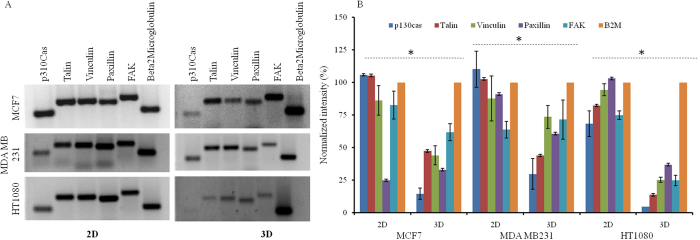
Figure 6.
mRNA profiling of migration specific genes in 2D and 3D spheroid condition. (A) Representative image of semi-quantitative RT-PCR products of five migration specific genes (p130 Cas, Talin, Vinculin, Paxillin, Focal adhesion kinase) and β2 microglobulin on the agarose gel. (B) Densitometric analysis of PCR bands is done using ImageJ software. Statistical analysis (Student’s T test) is done and significant difference between groups (2D and 3D) is identified (* denotes p < 0.05).

