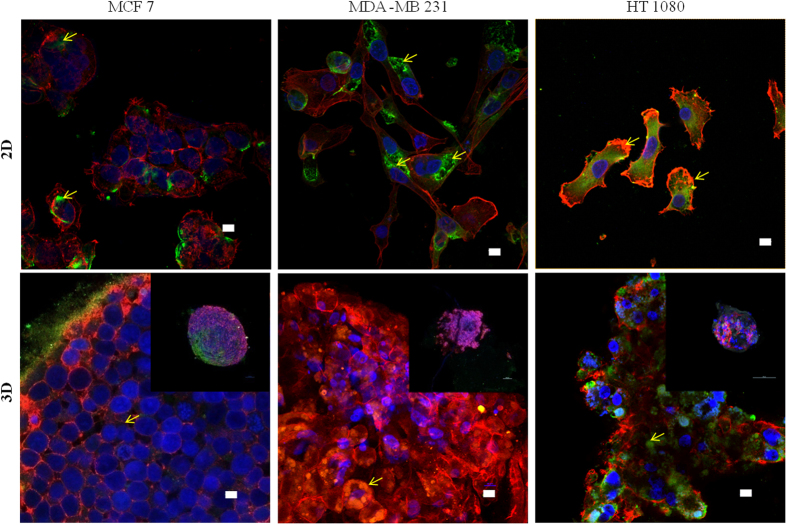
Figure 7.
Distribution of actin cytoskeleton and focal adhesion complex protein (vinculin) in 2D and 3D spheroid condition. Cells are grown in 2D (coverslip) and 3D (spheroid) conditions are fixed with 2% PFA and permeabilized with 0.01% Triton × 100. Staining is done with TRITC (red) conjugated phalloidin (actin); FITC (green) conjugated monoclonal anti-vinculin antibody (vinculin) and DAPI (blue) (nucleus). Imaging is done with 405, 488 and 653 nm Laser in Nikon AR1 confocal microscope using 60× oil objective. Spheroid imaging is done with optical Z scanning. The scale bar is 10 µm. Inset images in the lower panel are of a single spheroid in the 10× objective. Yellow arrows indicate vinculin distribution.

