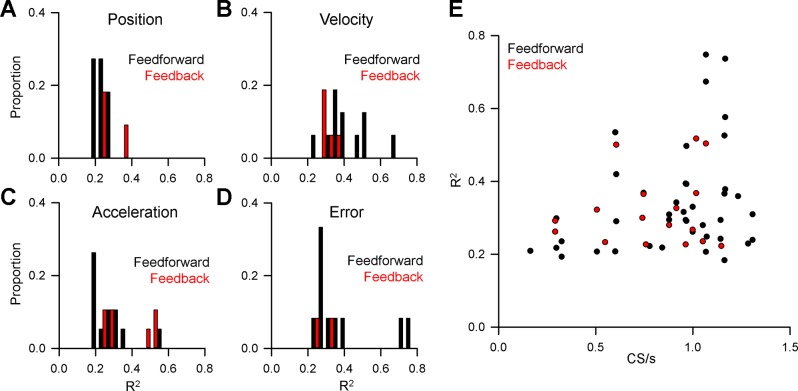
Fig. 7.
Population summary of the magnitude of CS encoding of behavior. Distribution of R2 values for feedforward (black bars) and feedback (red bars) relationships between CS firing and position (A), velocity (B), acceleration (C), and position error (D). E: R2 values for feedforward and feedback CS modulation as a function of mean CS firing rate.

