Fig. 9.
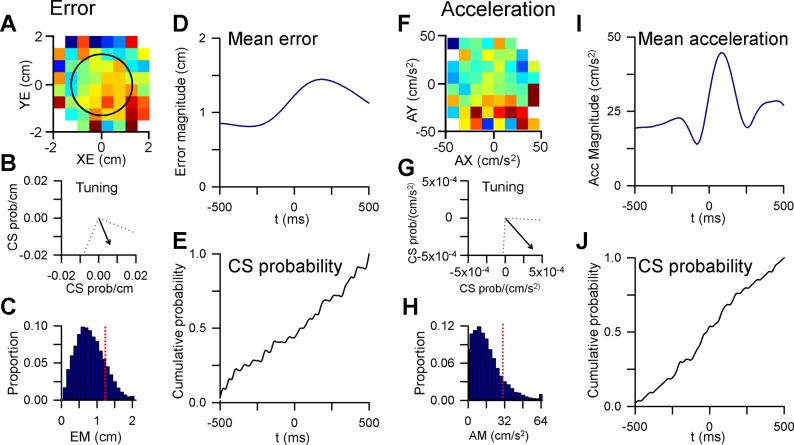
Event-related analysis of CS modulation. A: example Purkinje cell with significant feedforward CS tuning with position error. B: preferred direction of CS tuning with ± 45° window used for the analysis. C: probability distribution of error magnitude (EM) during tracking. Red dashed line indicates the target edge. D: average error magnitude aligned to the times, t = 0 ms, at which the cursor exited the target (error events) within ± 45° of the preferred direction vector shown in B. E: cumulative probability of CS firing over a ±500-ms window around the timing of error events. F: example Purkinje cell with significant feedforward CS tuning with acceleration. G: preferred direction of CS tuning. H: probability distribution of acceleration magnitude (AM) during tracking. Red dashed line indicates the mean + 1 SD of the distribution, the threshold used for identifying acceleration events. I: average acceleration magnitude aligned to the timing of acceleration events (t = 0 ms). J: cumulative probability of CS firing over a ±500-ms window around the timing of acceleration events.

