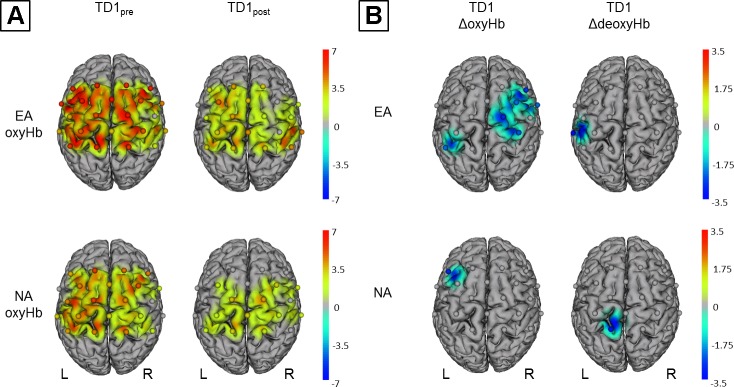
Fig. 4.
Within-group comparisons for oxyHb and deoxyHb on TD1. Channels (centered between transmitters and detectors) are shown for each image (L, left hemisphere; R, right hemisphere). Decreases are illustrated in dark blue and increases in dark red; colors represent t-values. All images are thresholded at P < 0.05. A: topographic images show significant increased oxyHb levels during SBTpre and SBTpost on TD1. B: topographic images show significant decreases in both oxyHb and deoxyHb from TD1pre to TD1post (see text for details).

