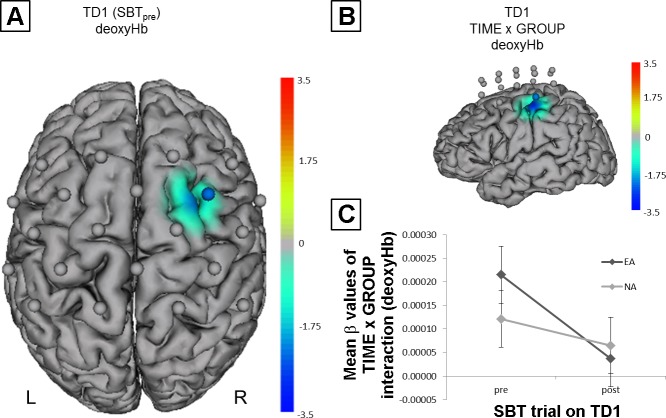
Fig. 5.
Initial fNIRS results (A) and time × group interaction (B and C). Channels (centered between transmitters and detectors) are shown for each image (L, left hemisphere; R, right hemisphere). Decreases are illustrated in dark blue and increases in dark red; colors represent t-values. All images are thresholded at P < 0.05. A: initial fNIRS results (SBTpre) on TD1 showing significant lower deoxyHb in right primary motor cortex (M1) and premotor cortex (PMC) during task performance for endurance athletes (EA) compared with nonathletes (NA). B: comparison of MBT-induced hemodynamic alterations during SBT performance (fNIRS SBTpre vs. SBTpost) revealed a significant time × group interaction for deoxyHb in left M1 and inferior parietal lobe (IPL). C: mean beta values (±SE) of time × group interaction (deoxyHb). The plot shows a significantly stronger decline of deoxyHb from TD1pre to TD1post in EA compared with NA.

