Figure 4.
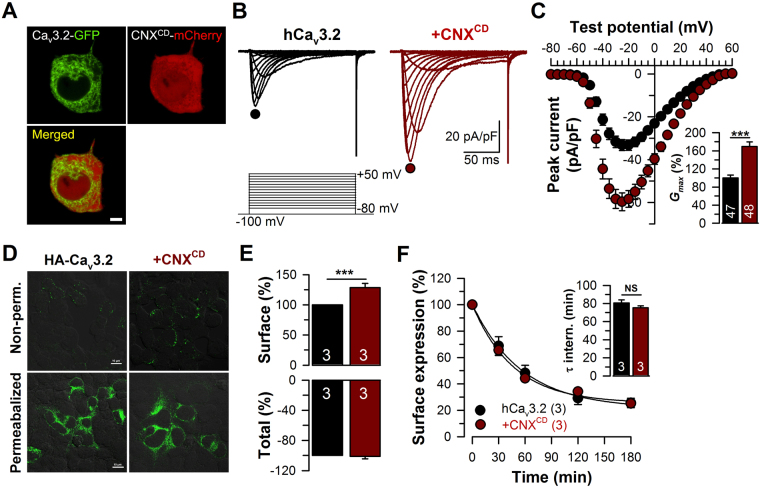
Uncoupling of hCav3.2 from the calnexin C-tail increases surface expression of the channel. (A) Confocal images of living tsA-201 cells expressing hCav3.2-GFP channels (green, top left pannel) along with the mCherry-taged cytosolic domain of CNX (CNXCD-mCherry) (red, top right panel). Overlaid images are also shown (bottom left panel). Note that in contrast to the CNXBD-mCherry construct (Fig. 3B), the CNXCD-mCherry construct that does not contain the ER transmembrane domain shows a diffuse expression pattern consistent with a soluble protein. (B) Representative Ba2+ current traces recorded from hCav3.2-HA- (left panel) and hCav3.2-HA/CNXCD-GFP-expressing tsA-201 cells (right panel) in response to 150-ms depolarizing steps varied from −80 to +50 mV from a holding potential of −100 mV. (C) Corresponding mean current/voltage relationships for hCav3.2-HA- (black circles, n = 47) and hCav3.2-HA/CNXCD-GFP-expressing cells (red circles, n = 48). The inset indicates the corresponding normalized maximum slope conductance G max. Data are presented as mean ± SEM and were analyzed by Student’s unpaired t test; ***p < 0.001. (D) Low magnification confocal images of non-permeabilized (top panels) and permeabilized (bottom panels) tsA-201 cells expressing hCav3.2-HA alone (left panels) and together with calnexin C-tail (CNXCD) (right panels) and stained for hCav3.2-HA (green) using a primary anti-HA antibody. (E) Corresponding mean surface and total expression of hCav3.2-HA channels expressed alone (black, n = 3) and in combination with CNXCD (red, n = 3), assessed from non-permeabilized and permeabilized cells, respectively. (F) Internalization kinetics at 37 °C of hCav3.2-HA channels expressed alone (black, n = 3) and in combination with CNXCD (red, n = 3). The inset indicates the time constant τ of internalization.

