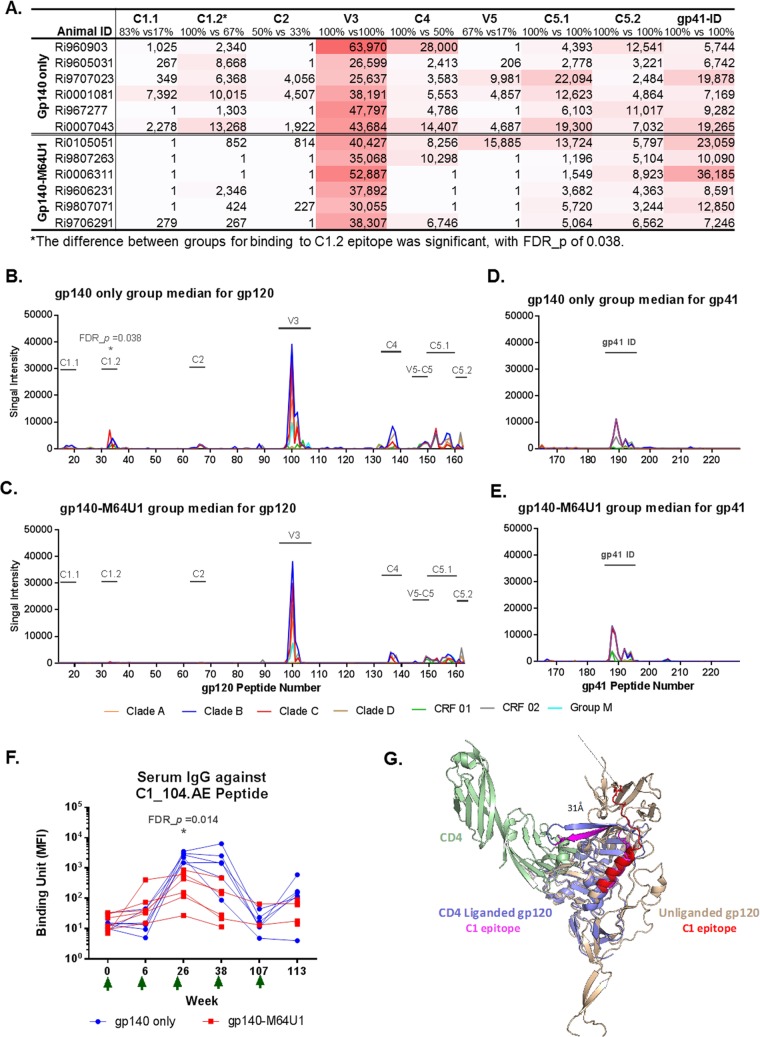
FIG 2.
Linear epitope specificity of serum IgG by epitope mapping (A to E) and BAMA (F). Week 26 mean binding intensity values for serum IgG for the gp140-only (B and D) and gp140-M64U1 (C and E) groups are shown for overlapping peptides of 7 consensus gp120 (B and C) and gp41 (D and E) sequences. Different colors represent different clades/circular recombinant forms (CRFs). Epitope regions identified in the study are indicated by text over a horizontal bar in plots. (A) Magnitude of binding to each epitope, calculated as the highest level of binding to a single peptide within each epitope region. The percentages listed for each epitope are the response rates to the epitope by the animals of the 2 groups (gp140 versus gp140-M64U1). The peptide ranges for the epitopes are as follows: C1.1, residues 16 to 21; C1.2, residues 32 to 39; C2, residues 65 to 68; V3, residues 97 to 104; C4, residues 133 to 139; V5-C5, residues 147 to 151; C5.1, residues 152 to 159; C5.2, residues 161 to 163; and gp41-ID, residues 187 to 194. The sequences of all peptides have been published previously (65). (F) Longitudinal binding to the C1_104.AE peptide (corresponds to the C1.2 epitope in epitope mapping) was measured by BAMA. Green arrows indicate times of immunization. (G) Structural modeling of the conformational change of the C1 epitope upon CD4 binding. The C1_104 epitope bends ∼90° from the unliganded gp120 conformation (gp120 monomer from SOSIP Env trimer; PDB entry 4TVP) (beige) to the CD4-liganded gp120 conformation (PDB entry 4RQS) (light blue). Binding of CD4 (PDB entry 4QRS; green) results in a >30-Å displacement of the C-terminal residue (stick representation) between the C1_104 epitope in the unliganded gp120 protein (red) and the CD4-bound C1_104 epitope (magenta).

