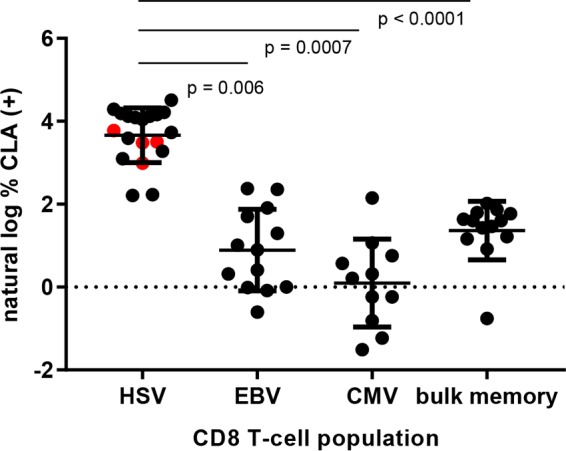
FIG 2.

CLA expression by virus-specific CD8 T cells in direct ex vivo stains (left three groups) or bulk memory CD8 T cells (right). The x axis indicates origin of peptide in HLA class I tetramer used to identify virus-specific CD8 T cells. Red data points for HSV indicate data derived from HSV-1-specific tetramers. Data are graphed as the natural log of the percent CLA+ cells. Horizontal bars indicate means, and error bars indicate standard deviations. P values are indicated for selected comparisons.
