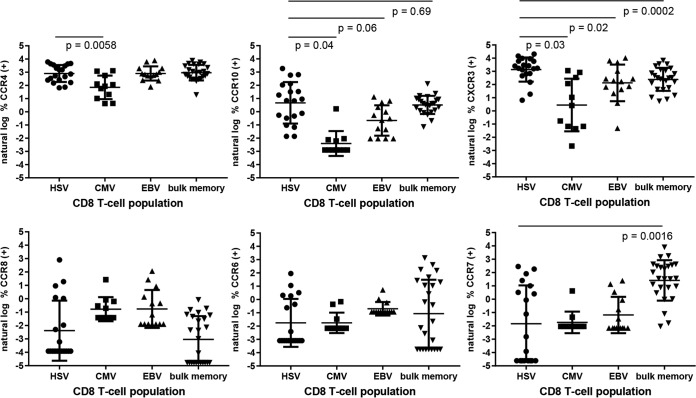
FIG 4.
ChR expression by circulating virus-specific CD8 T cells (left three groups in each graph) or bulk memory CD8 T cells (right). Data are shown as the natural log of the percent ChR+ cells. P values are shown for CCR10 and CXCR3; P values for other ChR are >0.05. Zero measurements were assigned a value of the natural log of 50% of the lowest measured value. Error bars indicate standard deviations.

