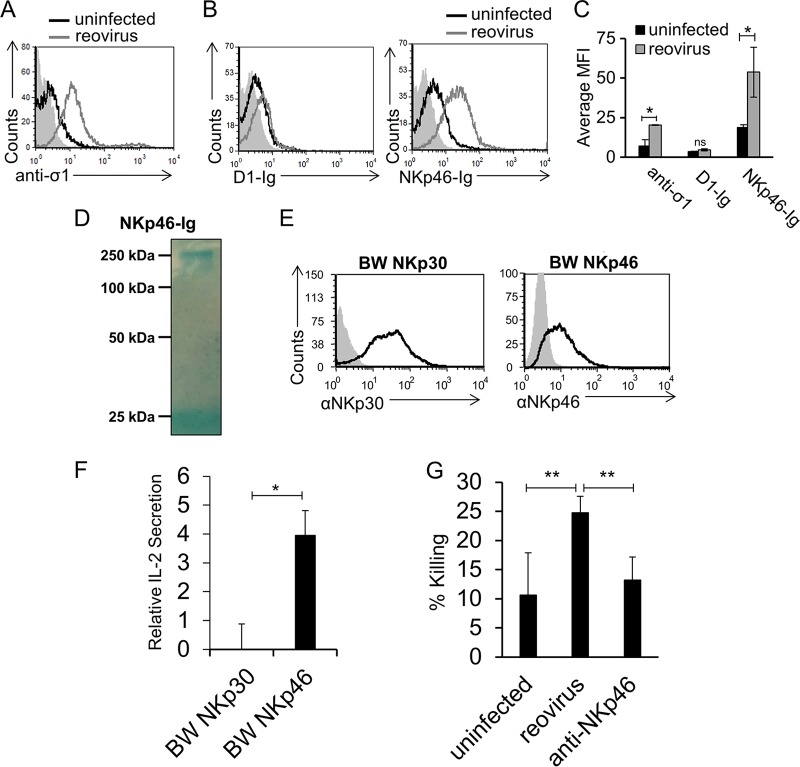
FIG 1.
NKp46 is activated by reovirus. (A) Vero cells were incubated with reovirus for 14 h and stained with anti-sigma1 antibody (open gray histogram). The filled gray histogram depicts the background staining of Vero cells with the secondary MAb in the absence of reovirus. The background staining of Vero cells in the presence of reovirus was similar and is not shown. The empty black histogram depicts the staining of uninfected Vero cells with anti-sigma1 antibody. (B) FACS staining of Vero cells incubated for 14 h in the presence or absence of reovirus. Staining was performed with D1-Ig and NKp46-Ig, as indicated on the x axis. The filled gray histograms depict the background staining of Vero cells with the secondary MAb in the absence of reovirus. The background staining of Vero cells in the presence of reovirus was similar and is not shown. The empty black histograms depict the staining of uninfected Vero cells with the fusion proteins indicated. The empty gray histograms depict the staining of Vero cells preincubated with reovirus and stained with the fusion proteins indicated. Shown are the results of one representative experiment out of three performed. (C) The median fluorescence intensity (MFI) of anti-sigma1 antibody, D1-Ig, and NKp46-Ig staining of uninfected and reovirus-infected cells in three different experiments. Each error bar represents the standard deviation (SD). Statistically significant differences are indicated. *, P < 0.05; ns, not significant. (D) Coomassie staining of the NKp46-Ig fusion protein used in panel B after gel electrophoresis under nonreducing conditions. The image was cropped and the background was adjusted for better clarity. (E) FACS staining of BW cells expressing NKp30-zeta (BW NKp30) and NKp46-zeta (BW NKp46). The empty black histograms depict staining with the MAb indicated, and the filled gray histograms depict background staining with the secondary MAb only. (F) The various BW cells expressing the chimeric proteins shown in panel E were cocultured with Vero cells preincubated in the presence or absence of reovirus for 14 h. IL-2 secretion was determined by ELISA. Relative IL-2 secretion, determined as described in Materials and Methods, is shown. Mean values and SD of three independent experiments are shown. Statistically significant differences are indicated. *, P < 0.05; ns, not significant. (G) Vero cells were incubated in the absence (designated uninfected) or presence of reovirus for 14 h and then cocultured with human NK cells. The human NK cells were preblocked with anti-NKp46 antibodies (designated anti-NKp46) or without antibodies (designated reovirus). Killing was performed for 5 h. The effector-to-target cell ratios ranged from 2:1 to 10:1. The mean values and SD of three independent experiments are shown. Statistically significant differences are indicated. **, P < 0.01. In all flow cytometry experiments, antibodies and fusion proteins were incubated with target cells on ice. Fusion proteins were incubated for 2 h, and antibodies were incubated for 1 h.

