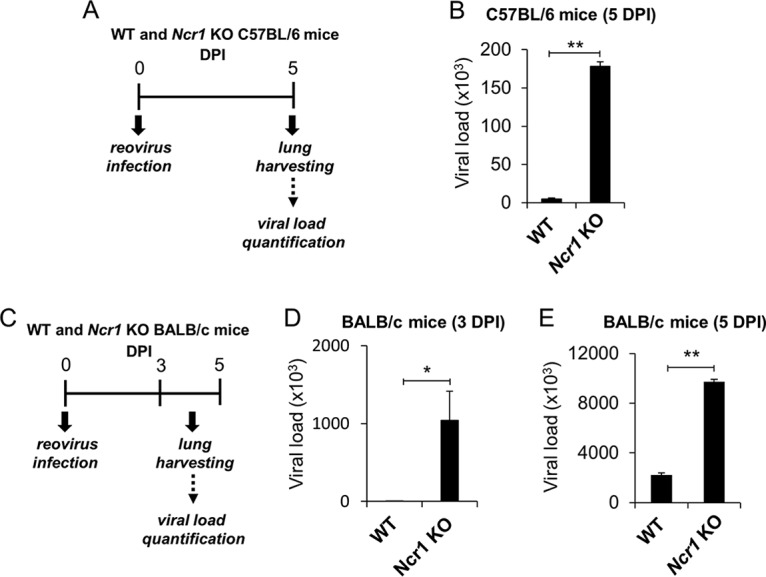
FIG 4.

NCR1 control reovirus infection in vivo. (A) Schematic representation of the experimental procedure used. Four- to 6-week-old C57BL/6 and BALB/c Ncr1+/+ (WT) and Ncr1gfp/gfp (Ncr1 KO) mice were each infected intranasally with 2.5 × 10⁶ PFU of reovirus type 3 (Dearing). Lungs were harvested 5 days postinfection, and viral loads in the lungs were determined by qRT-PCR. All results were normalized to mouse GAPDH and ActB expression. (B) Reovirus loads in the lungs of C57BL/6 Ncr1+/+ (WT) and Ncr1gfp/gfp (Ncr1 KO) mice (five per group). (C) Schematic representation of the experimental procedure used. Four- to 6-week-old BALB/c Ncr1+/+ (WT) and Ncr1gfp/gfp (Ncr1 KO) mice were each infected intranasally with 2.5 × 10⁶ PFU of reovirus type 3 (Dearing). Lungs were harvested 3 and 5 days postinfection, and viral loads in the lungs were determined by qRT-PCR. All results were normalized to mouse GAPDH and ActB expression. (D, E) Viral loads were determined 3 (D) and 5 (E) days postinfection (DPI). Shown are mean values derived from a pool of five mice per group. The y axes depict viral load measurements. Mean values and standard errors (bars) are from triplicate experiments. Statistically significant differences are indicated. *, P < 0.05; **, P < 0.01.
