FIG 6.
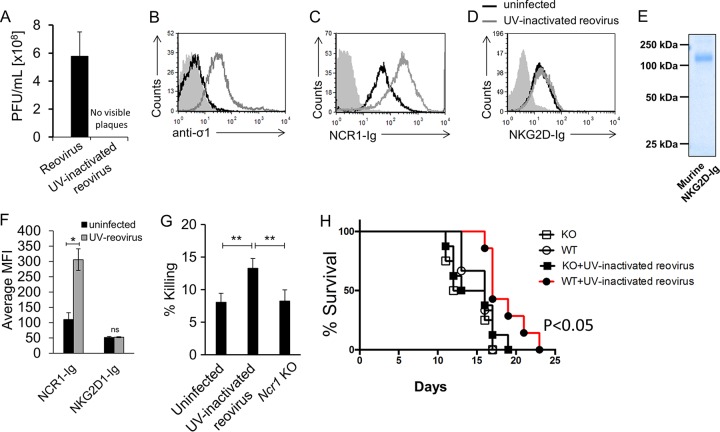
Specific evaluation of the role of NCR1 in a B16 melanoma model by reovirus-based treatment. (A) Viral titer quantification in reovirus stocks left untreated or inactivated by UV irradiation. The values on the y axis are the numbers of PFU per milliliter of viral stock. Presented are averages derived from two independent experiments. Each error bar represents the standard deviation (SD). (B to D) FACS staining of B16 cells incubated for 14 h in the presence (empty gray histograms) or absence (empty black histograms) of UV-inactivated reovirus. Staining was performed with anti-sigma1 antibody (B), NCR1-Ig (C), and NKG2D-Ig (D), as indicated on the x axes. The filled gray histograms depict the background staining of the parental Vero cells with the secondary MAb only. The background staining of Vero cells in the presence of UV-inactivated reovirus was similar and is not shown. Shown are the results of one representative experiment out of three performed. (E) Coomassie staining of NKG2D-Ig used in panel D after gel electrophoresis under nonreducing conditions. The image was cropped and the background was adjusted for better clarity. (F) Median fluorescence intensity (MFI) of the results presented in panels C and D. Presented are averages derived from three independent experiments. Each error bar represents the standard deviation (SD). Statistically significant differences are indicated. *, P < 0.05; ns, not significant. (G) B16 cells incubated with reovirus for 14 h were tested in a 5-h killing assay against Ncr1+/gfp (Ncr1 Het, “UV-inactivated reovirus”) and Ncr1gfp/gfp (Ncr1 KO) NK cells. The effector-to-target cell ratio was 1:1. The mean values and SD of three independent experiments are shown. Statistically significant differences are indicated. **, P < 0.01. (H) Percent survival of C57BL/6 Ncr1+/+ (WT) and Ncr1gfp/gfp (Ncr1 KO) mice treated with UV-inactivated reovirus or left untreated. Each UV-inactivated reovirus injection consisted of 2.5 × 10¹⁰ PFU per mouse. The empty circles represent untreated WT mice. The filled circles represent UV-inactivated-reovirus-treated WT mice. The empty squares represent untreated KO mice. The filled squares represent UV-inactivated-reovirus-treated KO mice. Shown are the results of one representative experiment out of two performed. Statistically significant differences in survival between treated and untreated WT mice are indicated in the graph. In all flow cytometry experiments, antibodies and fusion proteins were incubated with target cells on ice. Fusion proteins were incubated for 2 h, and antibodies were incubated for 1 h.

