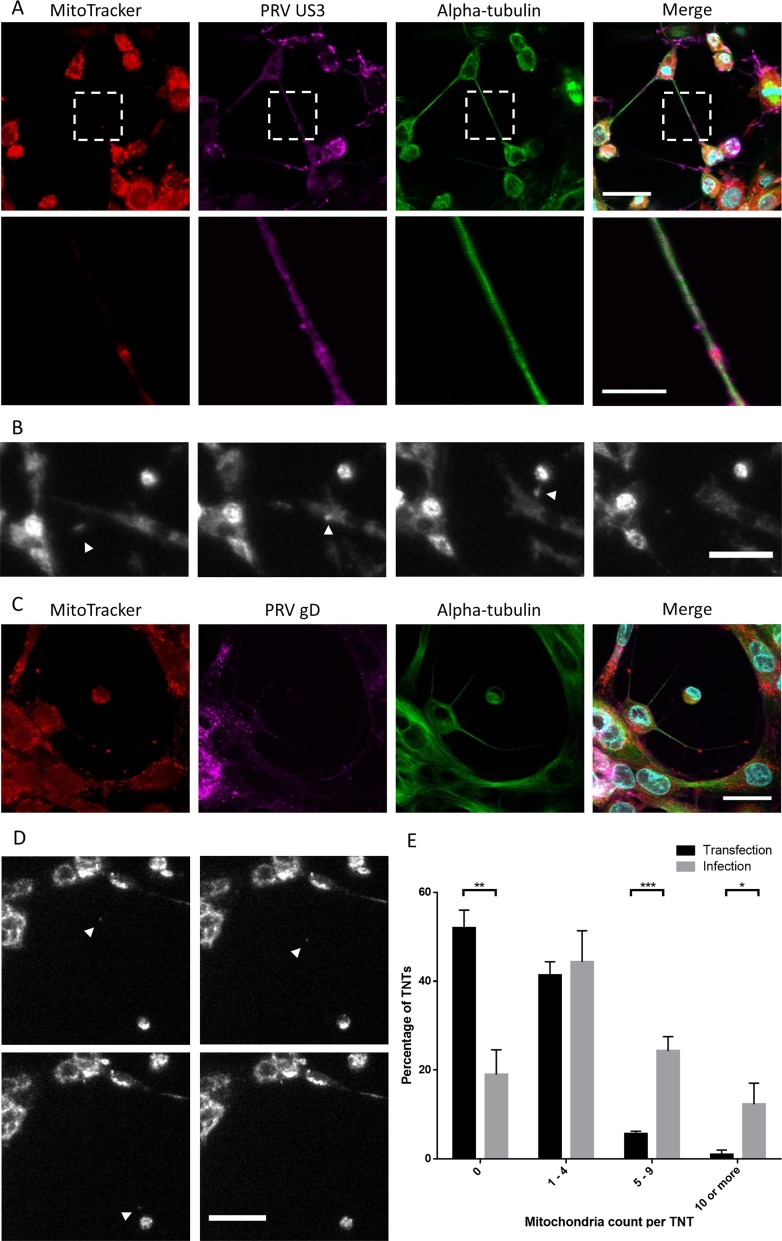
FIG 6.
Dynamic mitochondria are present in US3-induced TNTs in both US3-transfected cells and PRV-infected cells. (A) Mitochondrion (red) staining in US3-transfected (magenta) ST cells shows the presence of mitochondria in US3-induced TNTs. (B) Mitochondria are transported in TNTs in US3-transfected cells. White arrowheads show mitochondria transported in a TNT in the direction from a connected cell to a transfected cell. The interval between each frame and the next is 20 min. Bar, 30 μm. Images represent stills from a time lapse video (Movie S3). (C) Mitochondrion (red) staining in PRV-infected (magenta) ST cells shows the presence of mitochondria in TNTs. (D) Mitochondria are transported in TNTs in PRV-infected cells. White arrowheads show mitochondria transported in a TNT. The sequence is from upper left to bottom right. The interval between each frame and the next is 20 min. Bar, 30 μm. Images represent stills from a time lapse video (Movie S4). (E) Quantification of mitochondria present in US3-induced TNTs in transfected cells versus infected cells. Black bars show the number of mitochondria per TNT in US3-transfected cells. Gray bars show the number of mitochondria per TNT in PRV-infected cells. Error bars show standard deviations, with a single asterisk (*) indicating P values of <0.05, double asterisks (**) indicating P values of <0.01, and triple asterisks (***) indicating P values of <0.001.

