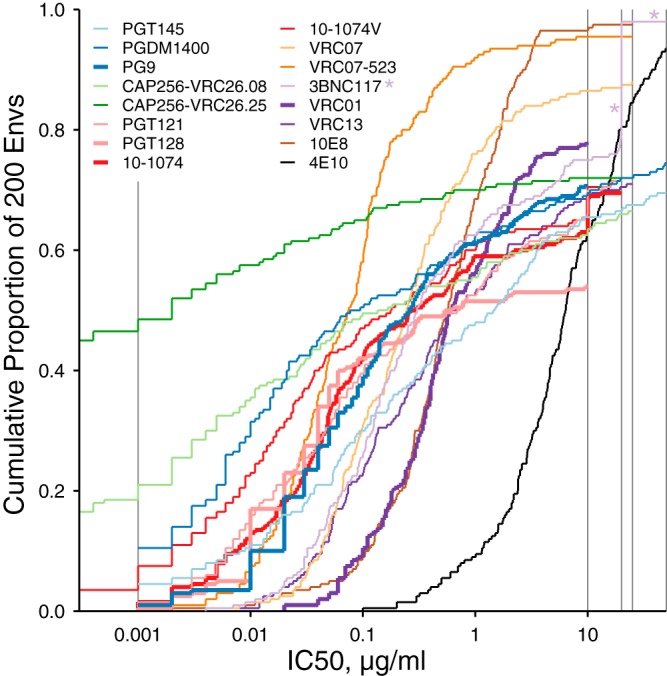
FIG 1.

Cumulative distributions of IC50 neutralization titers from 16 bnAbs. Each line shows the proportion of 200 Envs, with IC50s given by the value along the x axis. Gray lines at the lower and upper ranges of IC50s indicate where censoring cutoffs differed among assays. Asterisks are intended to help locate the example of 3BNC117 censored at 20 and 50 μg/ml discussed in the text.
