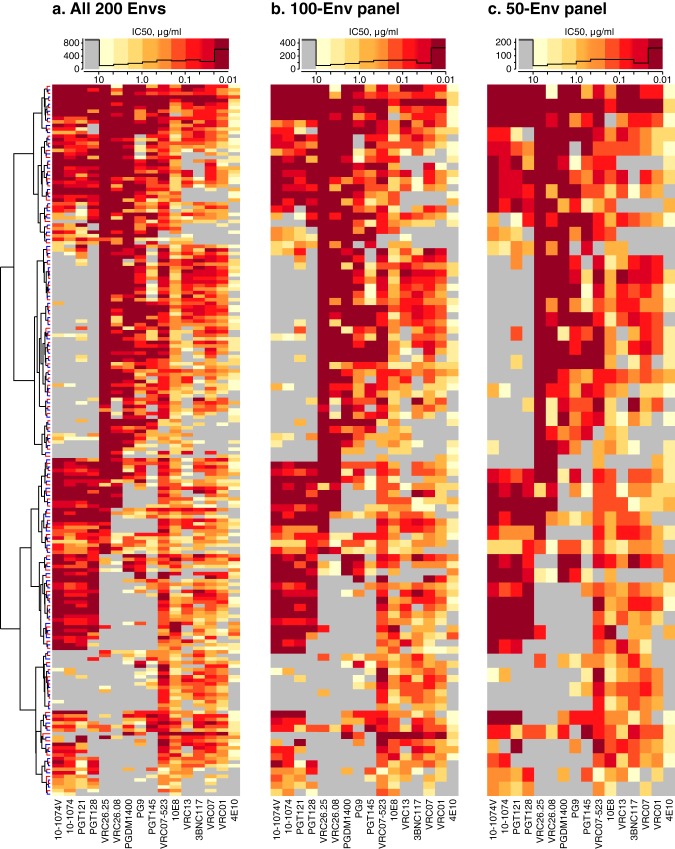
FIG 2.
Heat maps of IC50 neutralization titers from assaying 200 clade C envelopes against 16 bnAbs. (a) Hierarchically clustered heat map of IC50 titers of 200 Envs against 16 bnAbs. The Env dendrogram is shown; the bnAb dendrogram is not shown. Leaf colors indicate 100 viruses included (red) or excluded (blue) by downselection. The histogram (black line) above the heat map summarizes the distribution of assay results, with histogram breakpoints at 10, 4.64, 2.15, 1.00, 0.464, 0.215, 0.10, 0.0464, 0.0215, and 0.01 μg/ml. Low IC50s were censored at 0.01 μg/ml to standardize censoring thresholds across bnAbs. (b) 100-Env panel, downselected from alternating rows, i.e., red branches on the dendrogram. (c) 50-Env panel downselected by alternating over 100 Envs.

