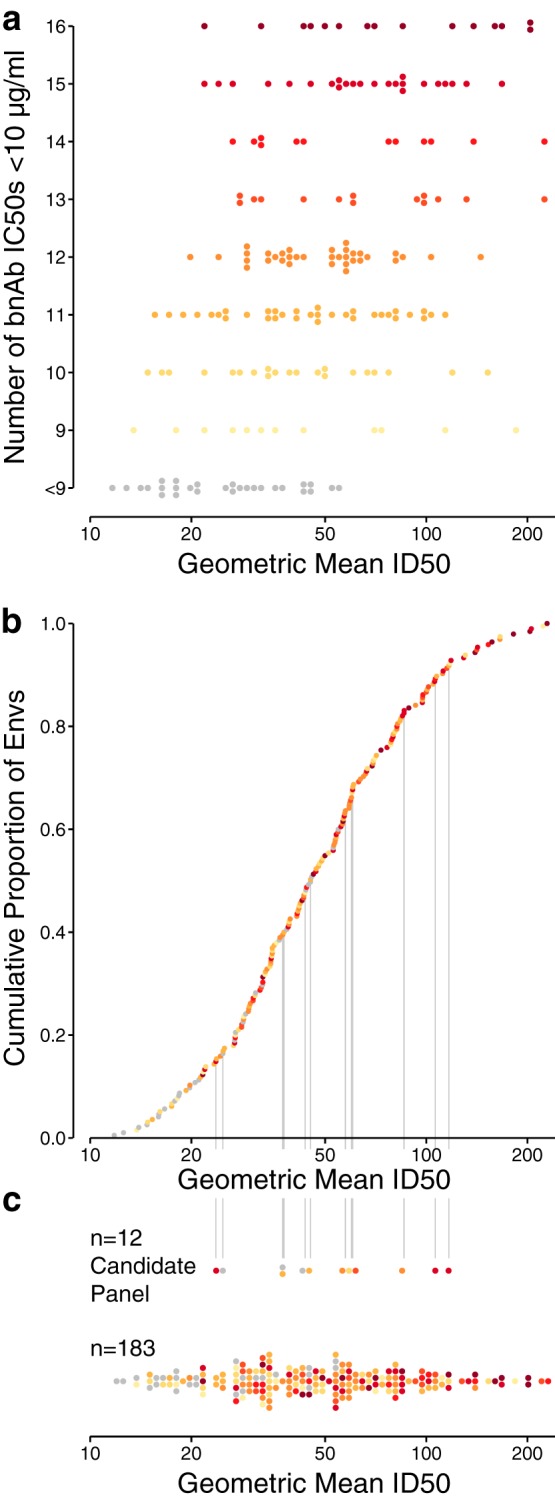
FIG 4.

Comparison of Env sensitivity to neutralization by plasma samples and bnAbs. (a) Geometric mean plasma ID50 per Env, stratified by the number of bnAbs with IC50s below 10 μg/ml, from among the 16 tested. (b) Cumulative distribution of geometric mean ID50s from 30 chronic plasma samples. Vertical lines indicate the 12 selected Envs. (c) Distribution of geometric mean ID50s between 12-virus panel and nonpanel Envs. Five Envs with geometric mean ID50s above 250 μg/ml are not shown. Colors in panels b and c summarize the number of neutralizing bnAbs shown in panel a.
