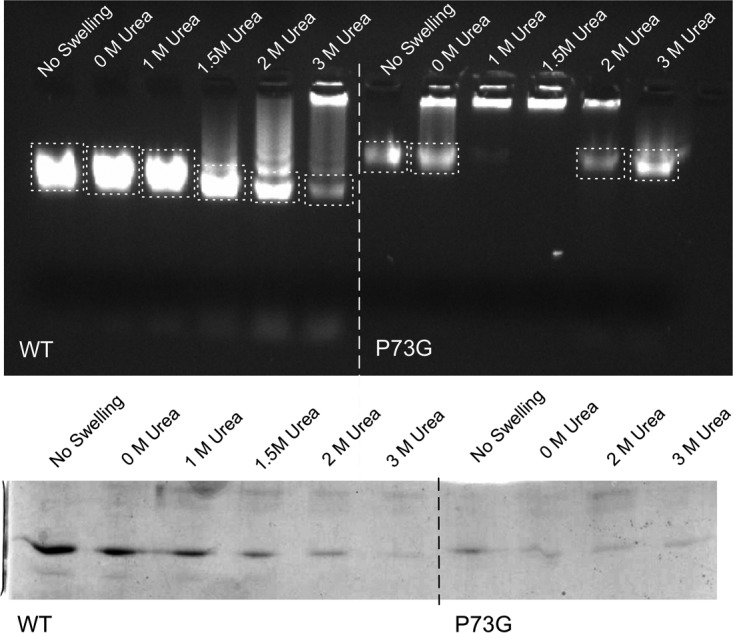
FIG 6.

Particle stability as measured by resistance to urea denaturation. The top figure shows the effects of urea on CNV mobility in a 1% agar gel made from 0.5× TB buffer, pH 8.3, that contained ethidium bromide for visualization. The loading well is located at the top of the gel. The dashed boxes denote the sections of the gel that were excised and run on an SDS-PAGE gel. The bottom figure shows an SDS-PAGE gel of the excised bands indicated in the top panel. Only the lower bands from the agar gel were analyzed by SDS-PAGE. Note that with the P73G mutant, the lower band disappears at 1 M urea and then reappears at higher urea concentrations.
