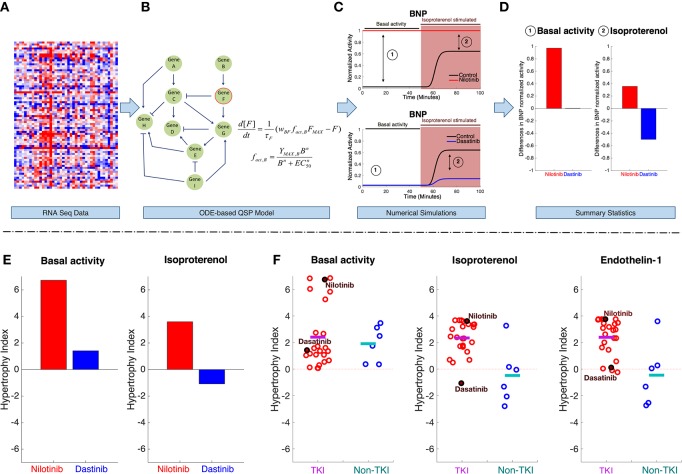
Figure 2.
Computational pipeline for integrating gene expression data with QSP models to enable understanding of TKI-induced cardiotoxicity. The pipeline starts with (A) mRNAseq data generated from drug treated cells. Using the mRNAseq data, parameters in the QSP model are altered to reflect changes in cell state after 48 h of drug treatment. Specifically, parameters describing maximal activity of model species are scaled based on the changes in gene expression (drug-treated vs. untreated cells). (B) The QSP model (Ryall et al., 2012) is composed of ordinary differential equations (ODEs) that describe activation and inactivation of cellular signaling dynamics. Simulations are performed to predict how drug-induced changes in gene expression will influence both basal signaling activity and how cells respond to stimuli. For instance, example simulation results in (C) show BNP activity, before, and after stimulation with isoproterenol (a β-adrenergic receptor agonist), in both untreated cells, and cells that have been exposed to two different TKIs for 48 h. These time course simulations predict drug-specific changes, such as an increase in BNP signaling after nilotinib treatment (top) compared with a decrease after dasatinib treatment (bottom). From these time courses, summary statistics (D) are collected from steady-state levels of BNP under two conditions (192 basal activity and 193 stimulus). (E) Using this pipeline, steady state changes in seven model outputs were computed and summed to generate a metric that we termed the “hypertrophy index.” This provides a summary statistic of the overall hypertrophic risk of a drug under different conditions (e.g., basal activity, left, and isoproterenol stimulation, right). (F) Hypertrophy indices computed, under three different conditions, from data obtained in a single cell line after treatment with 24 TKIs, and six non-TKIs (control drugs that are presumed to not cause cardiotoxicity). Each circle represents an individual drug, the line indicates the mean value for each group under basal activity (left), isoproterenol stimulation (middle), and endothelin-1 stimulation (right).

