-
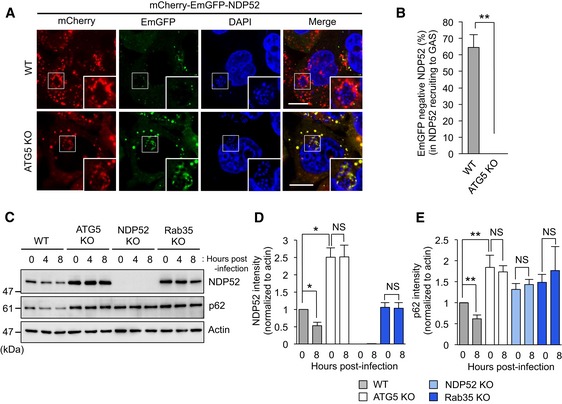
A
Confocal micrographs of wild‐type HeLa and ATG5 knockout cells expressing mCherry‐EmGFP‐NDP52 and infected with GAS for 4 h. The reporter appears yellow in autophagosomes due to fluorescence from mCherry and EmGFP, but appears red in autolysosomes due to acid quenching of GFP fluorescence. Scale bars, 10 μm.
-
B
Autolysosomal NDP52 (red fluorescence in panel A) as a percentage of total NDP52 (red and yellow fluorescence in panel A). Data are mean ± SEM of more than 30 cells.
-
C–E
Time course of NDP52 and p62 expression in wild‐type, ATG5, NDP52, and Rab35 knockout HeLa cells infected with GAS. Expression was normalized to actin and plotted in (D and E).
Data information: Data in (B, D, and E) are mean ± SEM from three independent experiments. Data were tested by two‐tailed Student's
t‐test: *
P < 0.05, **
P < 0.01, and NS for not significant.
Source data are available online for this figure.