
Figure EV4. Recruitment of NDP52 to starvation‐induced and basal autophagosomes.
-
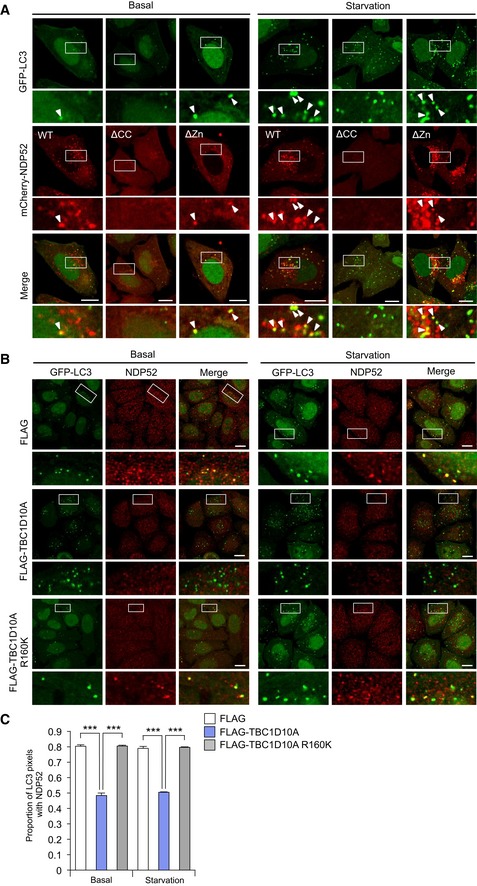
AConfocal micrographs of autophagosomes in HeLa cells stably expressing GFP‐LC3 along with mCherry‐NDP52, mCherry‐NDP52ΔCC, or mCherry‐NDP52ΔZn, and cultured in regular (basal) or starvation medium for 2 h. Scale bars, 10 μm. Arrowheads indicate the NDP52‐positive LC3 puncta.
-
B, CHeLa cells stably expressing GFP‐LC3 along with FLAG, FLAG‐TBC1D10A, or FLAG‐TBC1D10A R1660K were cultured in regular (basal) or starvation medium for 2 h and immunostained for NDP52. Confocal images (B) and proportion of LC3 puncta colocalized with NDP52 from at least 30 randomly selected cells were quantified by Mander's coefficient M1 (C). Scale bars, 10 μm. Data were tested by two‐tailed Student's t‐test: ***P < 0.001. Error bars indicate mean ± SEM.