
Figure 2.
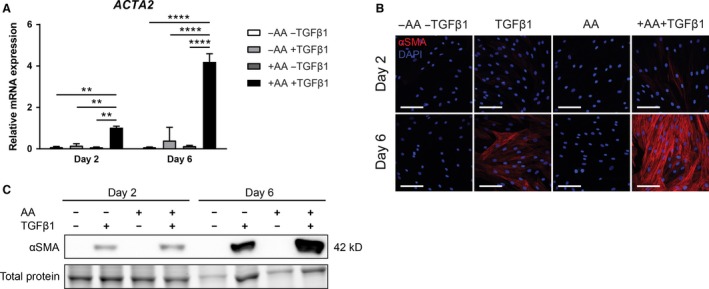
Ascorbic acid amplifies TGF β1‐induced α SMA expression. (A) Relative mRNA expression of ACTA2. Cells were exposed to bare medium or TGF β1 for 2 or 6 days with or without addition of AA. n = 3 individual experiments. (B) Representative immunofluorescent confocal photomicrographs of α SMA staining on days 2 and 6. Nuclei are visualized with DAPI. Original magnification 630×; scale bar = 100 μm. n = 3 individual experiments. (C) Immunoblot on complete cell lysates for α SMA after 2 and 6 days. Total protein loading control was visualized with trihalo compound which were activated on UV light exposure. A representative part of the total protein blot is shown. n = 3 individual experiments. Data are represented as mean ± SD. Two‐way ANOVA with Bonferroni posttest. **P < 0.01; ****P < 0.0001. AA, ascorbic acid; kD, kilo Dalton; α SMA, α smooth muscle actin; TGF β1, transforming growth factor β1.