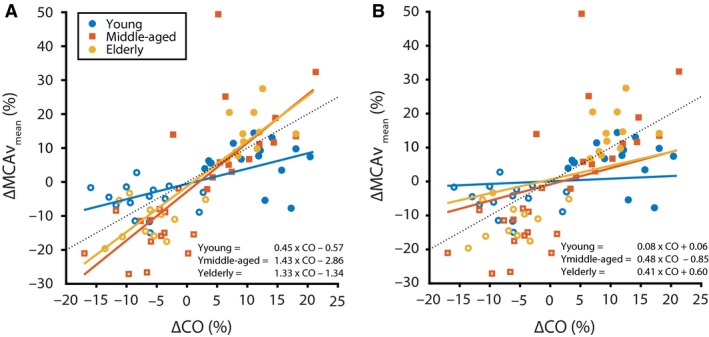
Figure 1.

Effect of age group on the CO–MCAV mean relation for (A) the basic model and (B) the extended model accounting for concurrent changes in MAP and PetCO 2. Dashed line represents line of unity. The equations for the regression line are given for the three age groups. The presented values are relative to the baseline condition.
