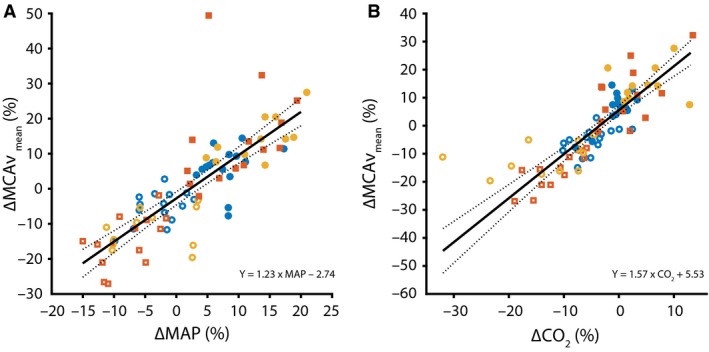
Figure 2.

Relation between ∆% MCAV mean and ∆% (A) MAP (n = 80) and (B) PetCO 2 (n = 77). Same color legend as in Figure 1. The black line indicates the regression slope (solid) with 95% confidence intervals (dashed). The equations for the regression line, using data from all age groups, are depicted. The presented values are relative to the baseline condition.
