Figure 1.

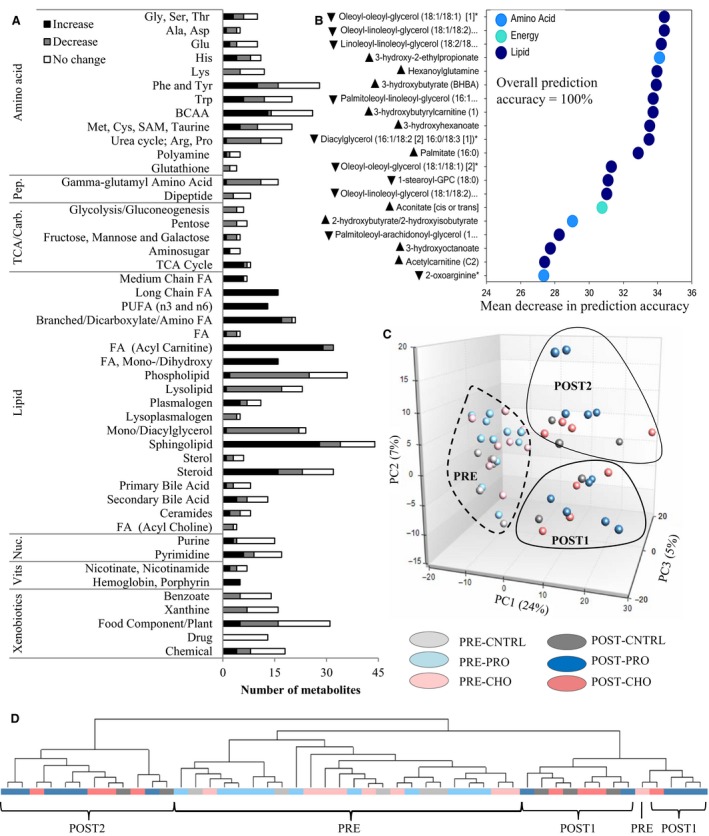
Military training elicits changes in plasma metabolite profiles. (A) Number of metabolites within each subpathway that significantly increased (black fill), decreased (gray fill), or did not change (white fill) from pre‐ to post‐training (n = 24; repeated measures ANOVA main effect of time, Q < 0.10). Only pathways with ≥2 metabolites are shown. (B) Top 20 metabolites with the strongest influence on the prediction accuracy of the random forest analysis are presented in order of importance (top to bottom). Random forest analysis used individual metabolite profiles to predict whether the samples were collected pre‐ or post‐training (n = 25). Mean decrease in prediction accuracy is the mean decrease in the percentage of observations classified correctly when that metabolite is assigned a random value. Larger mean decrease accuracy indicates greater importance to the overall prediction accuracy of the analysis. Arrows indicate direction of metabolite change from PRE to POST (main effect of time, Q < 0.10). (C) Principal components (PC) plot of plasma metabolite profiles (n = 25). Individual data points represent the metabolite composition within a single individual. Points closer together are more similar. PC1, PC2, and PC3, respectively, account for 24%, 7%, and 5% of the variability in plasma metabolite profiles. (D) Hierarchical complete‐linkage clustering of Euclidean distances of plasma metabolite profiles (n = 25). Branches (lines) within the same node (points where branches split) reflect similarity in metabolite composition. CHO, carbohydrate supplement group; CNTRL, control group (rations only); PRO, protein supplement group; BCAA, branched‐chain amino acid; Carb., carbohydrate; FA, fatty acid; Nuc., nucleotide; Pep., peptide; PUFA, polyunsaturated FA; TCA, tricarboxylic acid; SAM, S‐adenosylmethionine; Vits, vitamins.
