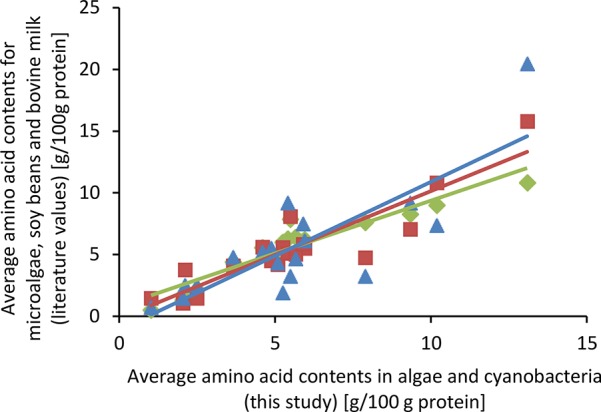
Figure 2.

Comparison of average amino acid contents of various microalgae (green),25 soy beans (red),49,50 and bovine milk (blue)51,52 with A. maxima, N. gaditana, T. impellucida, and S. dimorphus (this study). Lines depict linear regressions with determination coefficients of R2 = 0.89, 0.82, and 0.66 for microalgae, soy beans, and bovine milk, respectively.
